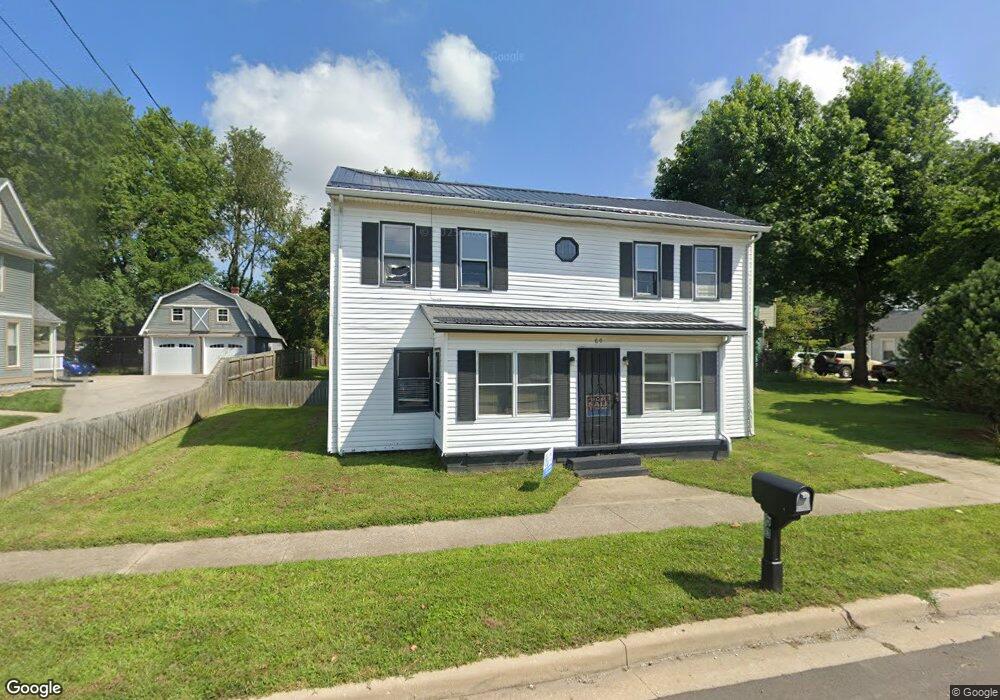
60 W Main St Monrovia, IN 46157
Estimated Value: $198,000 - $267,000
4
Beds
2
Baths
1,690
Sq Ft
$140/Sq Ft
Est. Value
About This Home
This home is located at 60 W Main St, Monrovia, IN 46157 and is currently estimated at $236,801, approximately $140 per square foot. 60 W Main St is a home located in Morgan County with nearby schools including Monrovia Elementary School, Monrovia Middle School, and Monrovia High School.
Ownership History
Date
Name
Owned For
Owner Type
Purchase Details
Closed on
Dec 31, 2012
Sold by
Collins Mitchell L and Collins Caryn C
Bought by
Collins Ii Mitchell L
Current Estimated Value
Home Financials for this Owner
Home Financials are based on the most recent Mortgage that was taken out on this home.
Original Mortgage
$61,224
Outstanding Balance
$42,390
Interest Rate
3.28%
Mortgage Type
New Conventional
Estimated Equity
$194,411
Purchase Details
Closed on
Sep 22, 2009
Sold by
Deutsche Bank National Trust Co
Bought by
Collins Mitchell L and Collins Caryn C
Purchase Details
Closed on
Mar 23, 2009
Sold by
Caito Philip A
Bought by
Deutsche Bank National Trust Co
Purchase Details
Closed on
May 26, 2005
Sold by
Riley Robert
Bought by
Caito Ii Philip A
Home Financials for this Owner
Home Financials are based on the most recent Mortgage that was taken out on this home.
Original Mortgage
$70,400
Interest Rate
8.25%
Mortgage Type
Adjustable Rate Mortgage/ARM
Create a Home Valuation Report for This Property
The Home Valuation Report is an in-depth analysis detailing your home's value as well as a comparison with similar homes in the area
Purchase History
| Date | Buyer | Sale Price | Title Company |
|---|---|---|---|
| Collins Ii Mitchell L | -- | None Available | |
| Collins Mitchell L | -- | -- | |
| Deutsche Bank National Trust Co | $76,909 | None Available | |
| Caito Ii Philip A | -- | None Available |
Source: Public Records
Mortgage History
| Date | Status | Borrower | Loan Amount |
|---|---|---|---|
| Open | Collins Ii Mitchell L | $61,224 | |
| Previous Owner | Caito Ii Philip A | $70,400 |
Source: Public Records
Tax History
| Year | Tax Paid | Tax Assessment Tax Assessment Total Assessment is a certain percentage of the fair market value that is determined by local assessors to be the total taxable value of land and additions on the property. | Land | Improvement |
|---|---|---|---|---|
| 2024 | $2,295 | $146,500 | $29,900 | $116,600 |
| 2023 | $2,197 | $146,800 | $29,900 | $116,900 |
| 2022 | $2,171 | $143,300 | $29,900 | $113,400 |
| 2021 | $1,470 | $117,400 | $18,200 | $99,200 |
| 2020 | $1,772 | $117,600 | $18,200 | $99,400 |
| 2019 | $1,613 | $98,500 | $18,200 | $80,300 |
| 2018 | $1,220 | $98,700 | $18,200 | $80,500 |
| 2017 | $1,127 | $90,200 | $18,200 | $72,000 |
| 2016 | $1,146 | $90,400 | $18,200 | $72,200 |
| 2014 | $301 | $89,200 | $18,200 | $71,000 |
| 2013 | $301 | $89,400 | $18,200 | $71,200 |
Source: Public Records
Map
Nearby Homes
- 60 Terrace Dr
- 0 N Baltimore Rd Unit MBR22079185
- 3079 W Patchwork Dr
- 3048 W Glacier Dr
- 0 N South R 39
- 2976 W Tapestry Dr
- 10931 N Longbranch St
- 2893 W Broderie Ln
- 10950 N Heirloom Dr
- 10960 N Heirloom Dr
- 11111 N Longbranch St
- 11108 N Trapunto Ln
- Lot 1 0 N S R 39
- 11149 N Sashing Way
- Stamford Plan at Homestead
- Henley Plan at Homestead
- Chatham Plan at Homestead
- Bellamy Plan at Homestead
- Aldridge Plan at Homestead
- Harmony Plan at Homestead