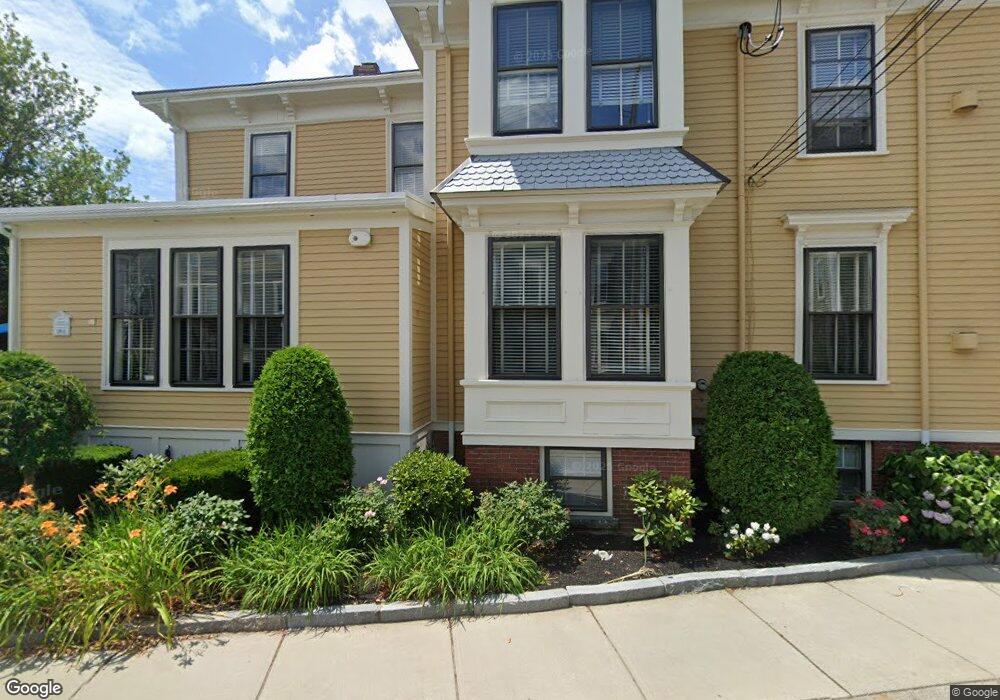
60 Washington Square Unit 3 Salem, MA 01970
Salem Common NeighborhoodEstimated Value: $767,000 - $857,000
2
Beds
3
Baths
1,819
Sq Ft
$444/Sq Ft
Est. Value
About This Home
This home is located at 60 Washington Square Unit 3, Salem, MA 01970 and is currently estimated at $808,512, approximately $444 per square foot. 60 Washington Square Unit 3 is a home located in Essex County with nearby schools including Saltonstall School, Carlton Elementary School, and Bates Elementary School.
Ownership History
Date
Name
Owned For
Owner Type
Purchase Details
Closed on
Sep 1, 2017
Sold by
Ethan Saulnier
Bought by
Jarvis Graeme
Current Estimated Value
Home Financials for this Owner
Home Financials are based on the most recent Mortgage that was taken out on this home.
Original Mortgage
$200,000
Outstanding Balance
$163,801
Interest Rate
3.82%
Estimated Equity
$644,711
Purchase Details
Closed on
Nov 6, 2015
Sold by
Siegel Josh and Siegel Erin
Bought by
Saulnier Ethan
Home Financials for this Owner
Home Financials are based on the most recent Mortgage that was taken out on this home.
Original Mortgage
$220,000
Interest Rate
3.88%
Mortgage Type
New Conventional
Purchase Details
Closed on
Aug 16, 2011
Sold by
Hodges Court Re Llc
Bought by
Siegel Josh and Siegel Erin
Create a Home Valuation Report for This Property
The Home Valuation Report is an in-depth analysis detailing your home's value as well as a comparison with similar homes in the area
Home Values in the Area
Average Home Value in this Area
Purchase History
| Date | Buyer | Sale Price | Title Company |
|---|---|---|---|
| Jarvis Graeme | $555,000 | -- | |
| Saulnier Ethan | $520,000 | -- | |
| Siegel Josh | $445,000 | -- |
Source: Public Records
Mortgage History
| Date | Status | Borrower | Loan Amount |
|---|---|---|---|
| Open | Siegel Josh | $200,000 | |
| Closed | Siegel Josh | -- | |
| Previous Owner | Saulnier Ethan | $220,000 |
Source: Public Records
Tax History
| Year | Tax Paid | Tax Assessment Tax Assessment Total Assessment is a certain percentage of the fair market value that is determined by local assessors to be the total taxable value of land and additions on the property. | Land | Improvement |
|---|---|---|---|---|
| 2025 | $8,834 | $779,000 | $0 | $779,000 |
| 2024 | $8,820 | $759,000 | $0 | $759,000 |
| 2023 | $8,438 | $674,500 | $0 | $674,500 |
| 2022 | $8,202 | $619,000 | $0 | $619,000 |
| 2021 | $8,070 | $584,800 | $0 | $584,800 |
| 2020 | $7,910 | $547,400 | $0 | $547,400 |
| 2019 | $7,861 | $520,600 | $0 | $520,600 |
| 2018 | $7,306 | $475,000 | $0 | $475,000 |
| 2017 | $7,167 | $451,900 | $0 | $451,900 |
| 2016 | $6,782 | $432,800 | $0 | $432,800 |
| 2015 | $6,787 | $413,600 | $0 | $413,600 |
Source: Public Records
Map
Nearby Homes
- 49 Essex St Unit 1R
- 49 Essex St Unit 2L
- 49 Essex St Unit 2R
- 49 Essex St Unit 1L
- 5 Herbert St
- 1 Boardman St Unit 6
- 23 Union St Unit 2
- 26 Daniels St Unit 5
- 26 Essex St Unit 2
- 129 Essex St Unit 8
- 11 Williams St Unit 1
- 96 Derby St Unit 1
- 7 Oliver St
- 7 English St Unit 3
- 1 English St
- 20 Central St Unit 213
- 28 Federal St Unit 10
- 1-7 Prince St & 48-54 Harbor St
- 99 Washington St Unit 33
- 11 Barton St
- 60 Washington Square Unit 1
- 60-62 Washington Square S Unit 3
- 60 Washington Square Unit 4
- 60 Washington Square Unit 1
- 60-62 Washington Square Unit 1
- 60 Washington Square Unit 62
- 60-62 Washington Square
- 60-62 Washington Square Unit 4
- 60-62 Washington Square Unit 3
- 60-62 Washington Square Unit 2
- 56 Washington Square
- 70 Essex St
- 72 Essex St
- 74 Essex St Unit 3
- 74 Essex St Unit 2
- 74 Essex St Unit 1
- 72 Washington Square
- 76 Essex St Unit 78
- 74 Washington Square Unit 3
- 74 Washington Square Unit 2
Your Personal Tour Guide
Ask me questions while you tour the home.