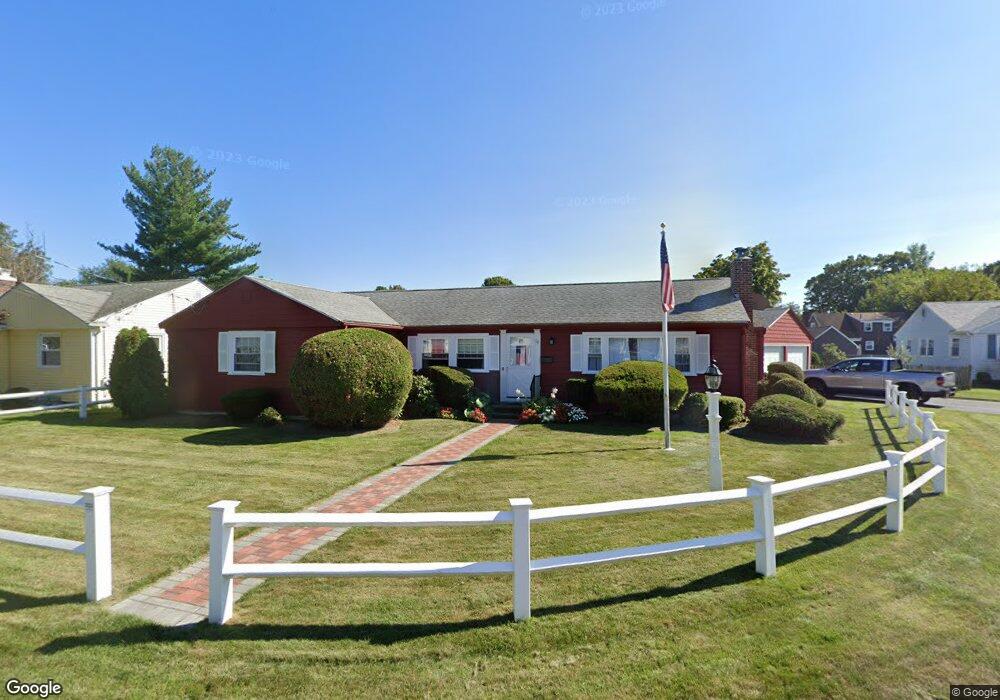
60 Winthrop St Riverside, RI 02915
Riverside NeighborhoodEstimated Value: $432,000 - $551,000
3
Beds
2
Baths
1,708
Sq Ft
$291/Sq Ft
Est. Value
About This Home
This home is located at 60 Winthrop St, Riverside, RI 02915 and is currently estimated at $497,689, approximately $291 per square foot. 60 Winthrop St is a home located in Providence County with nearby schools including East Providence High School, St Luke Elementary School, and St Mary Academy-Bay View.
Ownership History
Date
Name
Owned For
Owner Type
Purchase Details
Closed on
Aug 26, 2016
Sold by
Greene Judith W and Greene Robert Weisberger
Bought by
Weisberger Justin Z
Current Estimated Value
Home Financials for this Owner
Home Financials are based on the most recent Mortgage that was taken out on this home.
Original Mortgage
$198,850
Outstanding Balance
$157,484
Interest Rate
3.42%
Mortgage Type
New Conventional
Estimated Equity
$340,205
Purchase Details
Closed on
Oct 8, 2013
Sold by
Weisberger Sylvia B
Bought by
Sylvia B Weisberger T B and Sylvia Bweisberger
Create a Home Valuation Report for This Property
The Home Valuation Report is an in-depth analysis detailing your home's value as well as a comparison with similar homes in the area
Home Values in the Area
Average Home Value in this Area
Purchase History
| Date | Buyer | Sale Price | Title Company |
|---|---|---|---|
| Weisberger Justin Z | $205,000 | -- | |
| Sylvia B Weisberger T B | -- | -- | |
| Weisberger Justin Z | $205,000 | -- | |
| Sylvia B Weisberger T B | -- | -- |
Source: Public Records
Mortgage History
| Date | Status | Borrower | Loan Amount |
|---|---|---|---|
| Open | Weisberger Justin Z | $198,850 | |
| Closed | Sylvia B Weisberger T B | $198,850 |
Source: Public Records
Tax History Compared to Growth
Tax History
| Year | Tax Paid | Tax Assessment Tax Assessment Total Assessment is a certain percentage of the fair market value that is determined by local assessors to be the total taxable value of land and additions on the property. | Land | Improvement |
|---|---|---|---|---|
| 2025 | $5,961 | $456,100 | $140,300 | $315,800 |
| 2024 | $5,979 | $390,000 | $116,900 | $273,100 |
| 2023 | $5,756 | $390,000 | $116,900 | $273,100 |
| 2022 | $5,629 | $257,500 | $66,700 | $190,800 |
| 2021 | $5,536 | $257,500 | $61,600 | $195,900 |
| 2020 | $5,302 | $257,500 | $61,600 | $195,900 |
| 2019 | $5,155 | $257,500 | $61,600 | $195,900 |
| 2018 | $5,155 | $225,300 | $60,100 | $165,200 |
| 2017 | $5,040 | $225,300 | $60,100 | $165,200 |
| 2016 | $5,015 | $225,300 | $60,100 | $165,200 |
| 2015 | $4,803 | $209,300 | $55,700 | $153,600 |
| 2014 | $4,803 | $209,300 | $55,700 | $153,600 |
Source: Public Records
Map
Nearby Homes