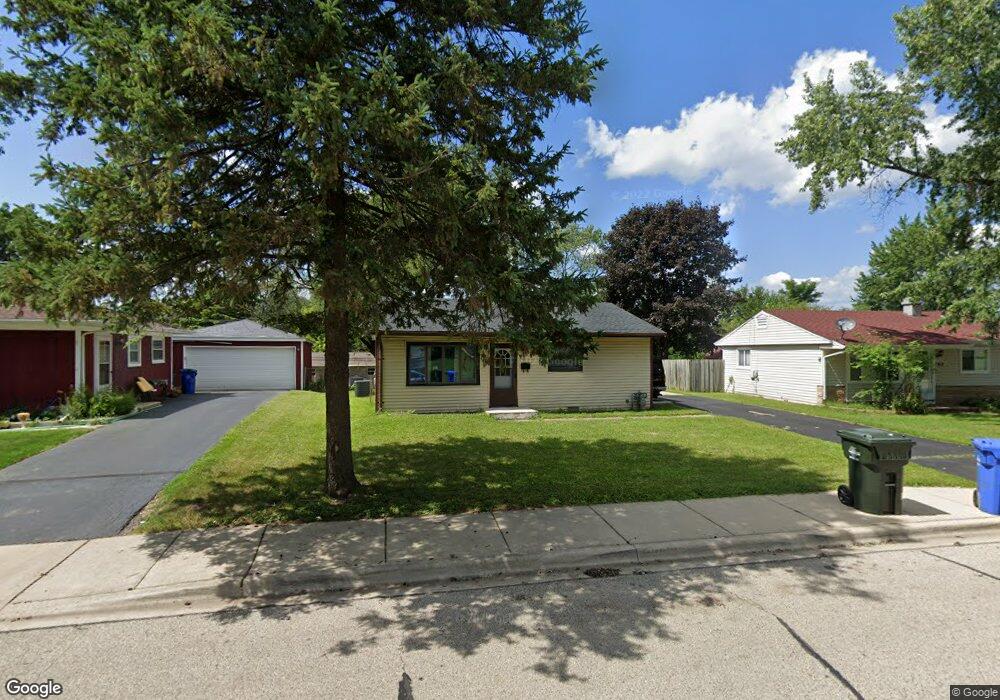
60 Wren Rd Unit 3 Carpentersville, IL 60110
Estimated Value: $225,000 - $288,608
3
Beds
1
Bath
1,500
Sq Ft
$174/Sq Ft
Est. Value
About This Home
This home is located at 60 Wren Rd Unit 3, Carpentersville, IL 60110 and is currently estimated at $260,402, approximately $173 per square foot. 60 Wren Rd Unit 3 is a home located in Kane County with nearby schools including Meadowdale Elementary School, Carpentersville Middle School, and Dundee-Crown High School.
Ownership History
Date
Name
Owned For
Owner Type
Purchase Details
Closed on
Dec 28, 2017
Sold by
Mohammed Saleem and Mohammed Salcema
Bought by
Morales Julio Nunez
Current Estimated Value
Home Financials for this Owner
Home Financials are based on the most recent Mortgage that was taken out on this home.
Original Mortgage
$142,963
Outstanding Balance
$123,047
Interest Rate
4.75%
Mortgage Type
FHA
Estimated Equity
$137,355
Purchase Details
Closed on
May 12, 2014
Sold by
Zapata Juan M
Bought by
Mohammed Saleem
Purchase Details
Closed on
Oct 23, 2001
Sold by
Zapata Eva
Bought by
Zapata Juan M
Purchase Details
Closed on
Jul 15, 1996
Sold by
Thomas Raymond E and Thomas Anita J
Bought by
Zapata Juan M and Zapata Eva
Home Financials for this Owner
Home Financials are based on the most recent Mortgage that was taken out on this home.
Original Mortgage
$96,012
Interest Rate
8.31%
Mortgage Type
FHA
Create a Home Valuation Report for This Property
The Home Valuation Report is an in-depth analysis detailing your home's value as well as a comparison with similar homes in the area
Home Values in the Area
Average Home Value in this Area
Purchase History
| Date | Buyer | Sale Price | Title Company |
|---|---|---|---|
| Morales Julio Nunez | $148,000 | Attorney | |
| Mohammed Saleem | -- | None Available | |
| Zapata Juan M | -- | -- | |
| Zapata Juan M | $96,500 | -- |
Source: Public Records
Mortgage History
| Date | Status | Borrower | Loan Amount |
|---|---|---|---|
| Open | Morales Julio Nunez | $142,963 | |
| Previous Owner | Zapata Juan M | $96,012 |
Source: Public Records
Tax History Compared to Growth
Tax History
| Year | Tax Paid | Tax Assessment Tax Assessment Total Assessment is a certain percentage of the fair market value that is determined by local assessors to be the total taxable value of land and additions on the property. | Land | Improvement |
|---|---|---|---|---|
| 2024 | $5,016 | $74,229 | $12,553 | $61,676 |
| 2023 | $4,940 | $66,789 | $11,295 | $55,494 |
| 2022 | $4,335 | $55,787 | $11,295 | $44,492 |
| 2021 | $4,228 | $52,674 | $10,665 | $42,009 |
| 2020 | $4,156 | $51,490 | $10,425 | $41,065 |
| 2019 | $4,057 | $48,880 | $9,897 | $38,983 |
| 2018 | $3,784 | $44,131 | $9,701 | $34,430 |
| 2017 | $3,760 | $36,656 | $9,075 | $27,581 |
| 2016 | $3,480 | $31,631 | $8,787 | $22,844 |
| 2015 | -- | $24,842 | $8,234 | $16,608 |
| 2014 | -- | $22,426 | $8,007 | $14,419 |
| 2013 | -- | $23,112 | $8,252 | $14,860 |
Source: Public Records
Map
Nearby Homes