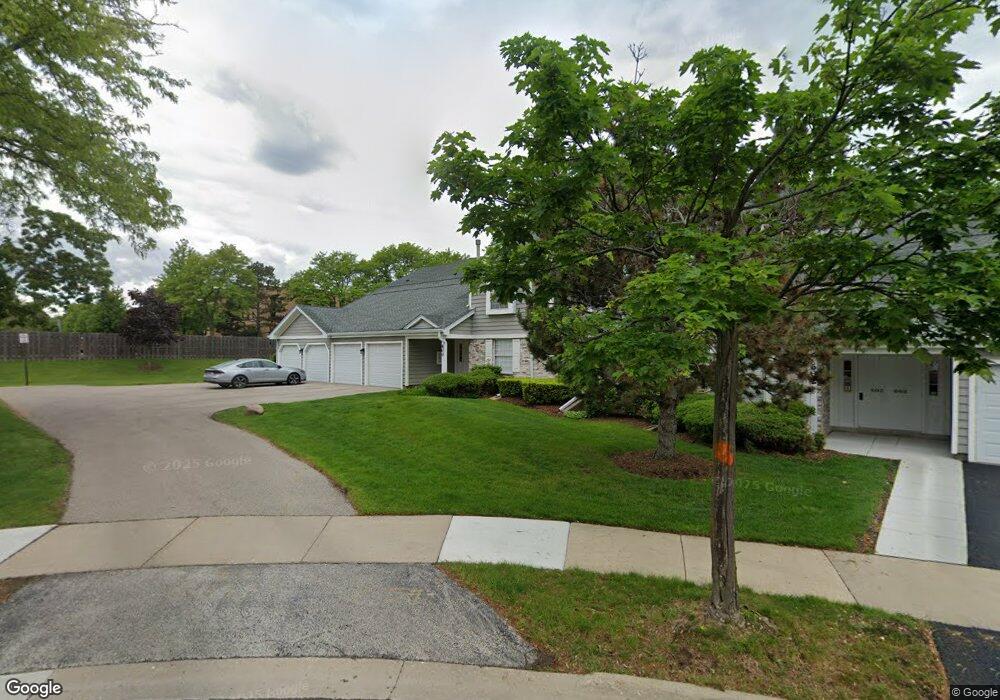
600 Berkley Ct Unit 1212L Schaumburg, IL 60194
East Schaumburg NeighborhoodEstimated Value: $264,689 - $310,000
2
Beds
--
Bath
1,200
Sq Ft
$238/Sq Ft
Est. Value
About This Home
This home is located at 600 Berkley Ct Unit 1212L, Schaumburg, IL 60194 and is currently estimated at $285,172, approximately $237 per square foot. 600 Berkley Ct Unit 1212L is a home located in Cook County with nearby schools including Everett Dirksen Elementary School, Robert Frost Junior High School, and J B Conant High School.
Ownership History
Date
Name
Owned For
Owner Type
Purchase Details
Closed on
Oct 13, 2005
Sold by
Geroulis Konstantinos
Bought by
Geroulis Konstantinos and Wieclaw Monika
Current Estimated Value
Home Financials for this Owner
Home Financials are based on the most recent Mortgage that was taken out on this home.
Original Mortgage
$176,400
Interest Rate
6.13%
Mortgage Type
New Conventional
Purchase Details
Closed on
Dec 28, 2004
Sold by
Prendergast Joan and Prendergast Joan M
Bought by
Geroulis Kontantinos
Home Financials for this Owner
Home Financials are based on the most recent Mortgage that was taken out on this home.
Original Mortgage
$174,600
Interest Rate
5.77%
Mortgage Type
Unknown
Purchase Details
Closed on
Jun 20, 1994
Sold by
Zak Michael G
Bought by
Prendergast Joan M
Home Financials for this Owner
Home Financials are based on the most recent Mortgage that was taken out on this home.
Original Mortgage
$97,850
Interest Rate
5.75%
Create a Home Valuation Report for This Property
The Home Valuation Report is an in-depth analysis detailing your home's value as well as a comparison with similar homes in the area
Home Values in the Area
Average Home Value in this Area
Purchase History
| Date | Buyer | Sale Price | Title Company |
|---|---|---|---|
| Geroulis Konstantinos | -- | -- | |
| Geroulis Kontantinos | $194,000 | Multiple | |
| Prendergast Joan M | $109,000 | Plm Title Company |
Source: Public Records
Mortgage History
| Date | Status | Borrower | Loan Amount |
|---|---|---|---|
| Previous Owner | Geroulis Konstantinos | $176,400 | |
| Previous Owner | Geroulis Kontantinos | $174,600 | |
| Previous Owner | Prendergast Joan M | $97,850 |
Source: Public Records
Tax History Compared to Growth
Tax History
| Year | Tax Paid | Tax Assessment Tax Assessment Total Assessment is a certain percentage of the fair market value that is determined by local assessors to be the total taxable value of land and additions on the property. | Land | Improvement |
|---|---|---|---|---|
| 2024 | $4,386 | $18,973 | $5,834 | $13,139 |
| 2023 | $4,224 | $18,973 | $5,834 | $13,139 |
| 2022 | $4,224 | $18,973 | $5,834 | $13,139 |
| 2021 | $3,656 | $15,394 | $7,474 | $7,920 |
| 2020 | $3,661 | $15,394 | $7,474 | $7,920 |
| 2019 | $3,668 | $17,114 | $7,474 | $9,640 |
| 2018 | $2,741 | $12,568 | $6,289 | $6,279 |
| 2017 | $2,715 | $12,568 | $6,289 | $6,279 |
| 2016 | $2,782 | $12,568 | $6,289 | $6,279 |
| 2015 | $3,079 | $12,916 | $5,469 | $7,447 |
| 2014 | $3,062 | $12,916 | $5,469 | $7,447 |
| 2013 | $2,966 | $12,916 | $5,469 | $7,447 |
Source: Public Records
Map
Nearby Homes
- 601 Hanover Ct Unit Z2
- 602 Eastview Ct Unit Z1
- 600 Eastview Ct Unit X1
- 121 Chatsworth Cir
- 325 Bayview Point Unit 56B
- 22 Ascot Cir
- 28 Ascot Cir
- 751 Edgelake Point Unit 68C
- 85 Marble Hill Ct Unit A1
- 350 Newgate Ct Unit 2Z
- 223 Gareth Ln
- 91 Lambert Dr Unit B1
- 287 Pembridge Ln Unit B2
- 147 Fulbright Ln
- 22 Waterbury Ln Unit N1
- 153 Fulbright Ln
- 802 Stonewall Ct Unit 55
- 465 Apache Ln
- 125 Cleveland Ct Unit M2
- 1871 Fox Run Dr Unit A
- 600 Berkley Ct Unit 1212L
- 600 Berkley Ct Unit 1212L
- 600 Berkley Ct Unit 1212L
- 600 Berkley Ct Unit X1
- 600 Berkley Ct Unit W1
- 600 Berkley Ct Unit X2
- 602 Berkley Ct Unit 1212R
- 602 Berkley Ct Unit 1212R
- 602 Berkley Ct Unit 1212R
- 602 Berkley Ct Unit 1212R
- 602 Berkley Ct Unit V1
- 602 Berkley Ct Unit V2
- 601 Berkley Ct Unit V1
- 601 Berkley Ct Unit 1111R
- 601 Berkley Ct Unit 1111R
- 601 Berkley Ct Unit 1111R
- 601 Berkley Ct Unit 1111R
- 601 Berkley Ct Unit Z1
- 601 Berkley Ct Unit V2
- 603 Stone Circle Ct Unit 161