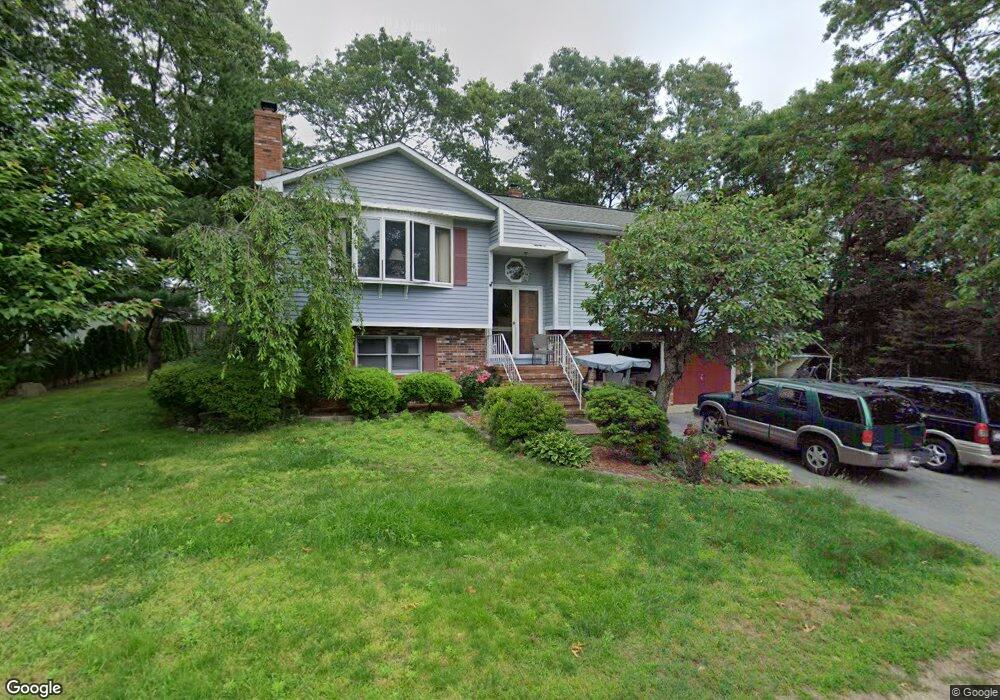
600 Bullock St Fall River, MA 02720
Bank Street NeighborhoodEstimated Value: $488,000 - $519,000
3
Beds
2
Baths
2,172
Sq Ft
$234/Sq Ft
Est. Value
About This Home
This home is located at 600 Bullock St, Fall River, MA 02720 and is currently estimated at $507,820, approximately $233 per square foot. 600 Bullock St is a home located in Bristol County with nearby schools including Mary Fonseca Elementary School, Talbot Innovation School, and B M C Durfee High School.
Ownership History
Date
Name
Owned For
Owner Type
Purchase Details
Closed on
Nov 1, 2001
Sold by
Lucciola Randy and Lucciola Denise
Bought by
Mcpherson William F and Mcpherson Verna J
Current Estimated Value
Purchase Details
Closed on
Mar 24, 1998
Sold by
Dasilva Renato
Bought by
Lucciola Randy and Normandin Denise
Create a Home Valuation Report for This Property
The Home Valuation Report is an in-depth analysis detailing your home's value as well as a comparison with similar homes in the area
Home Values in the Area
Average Home Value in this Area
Purchase History
| Date | Buyer | Sale Price | Title Company |
|---|---|---|---|
| Mcpherson William F | $240,000 | -- | |
| Lucciola Randy | $141,000 | -- |
Source: Public Records
Mortgage History
| Date | Status | Borrower | Loan Amount |
|---|---|---|---|
| Open | Lucciola Randy | $50,000 | |
| Open | Lucciola Randy | $144,000 | |
| Closed | Lucciola Randy | $15,000 |
Source: Public Records
Tax History
| Year | Tax Paid | Tax Assessment Tax Assessment Total Assessment is a certain percentage of the fair market value that is determined by local assessors to be the total taxable value of land and additions on the property. | Land | Improvement |
|---|---|---|---|---|
| 2025 | $4,830 | $421,800 | $138,200 | $283,600 |
| 2024 | $4,412 | $384,000 | $132,800 | $251,200 |
| 2023 | $3,860 | $314,600 | $119,300 | $195,300 |
| 2022 | $3,506 | $277,800 | $110,400 | $167,400 |
| 2021 | $3,807 | $275,300 | $104,300 | $171,000 |
| 2020 | $3,782 | $261,700 | $100,400 | $161,300 |
| 2019 | $3,816 | $261,700 | $100,400 | $161,300 |
| 2018 | $3,696 | $252,800 | $100,400 | $152,400 |
| 2017 | $3,465 | $247,500 | $100,400 | $147,100 |
| 2016 | $3,146 | $230,800 | $100,400 | $130,400 |
| 2015 | $2,970 | $227,100 | $93,900 | $133,200 |
| 2014 | $2,857 | $227,100 | $93,900 | $133,200 |
Source: Public Records
Map
Nearby Homes
- 603 David St
- 590 Bullock St
- 601 Bullock St
- 263 Hyacinth St
- 211 Hyacinth St
- 167 Hyacinth St
- 600 David St
- 242 Hyacinth St
- 275 Hyacinth St
- 260 Hyacinth St
- 192 Hyacinth St
- 147 Hyacinth St
- 272 Hyacinth St
- 291 Hyacinth St
- 532 Bullock St
- 172 Hyacinth St
- 533 David St
- 531 Bullock St
- 294 Hyacinth St
- 538 David St
Your Personal Tour Guide
Ask me questions while you tour the home.