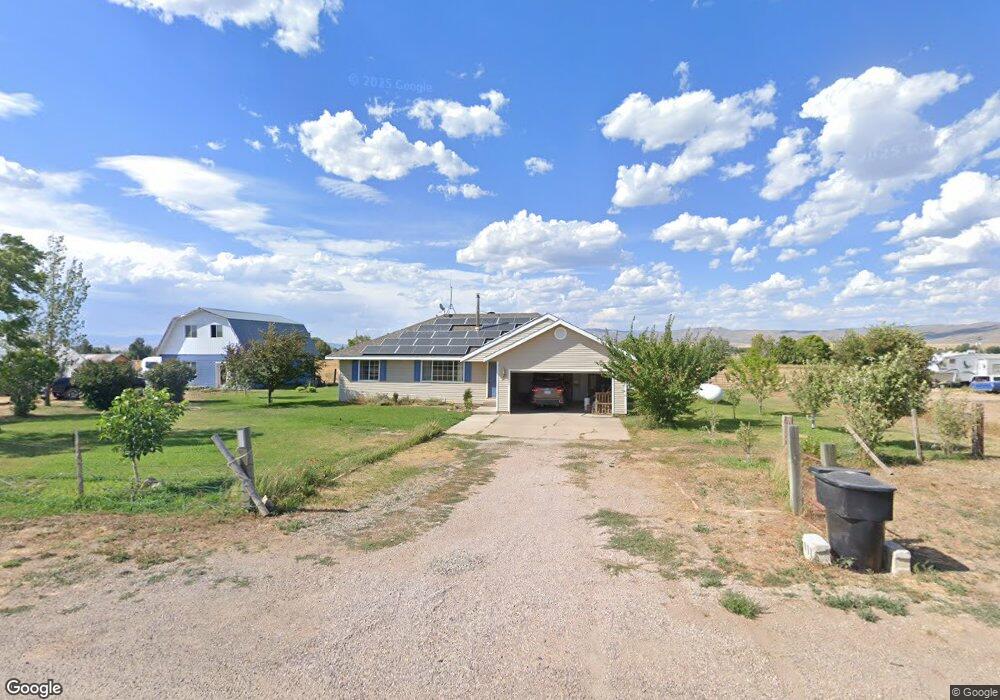
600 Cemetery Rd Dingle, ID 83233
Estimated Value: $350,000 - $406,000
3
Beds
3
Baths
1,404
Sq Ft
$267/Sq Ft
Est. Value
About This Home
This home is located at 600 Cemetery Rd, Dingle, ID 83233 and is currently estimated at $374,547, approximately $266 per square foot. 600 Cemetery Rd is a home located in Bear Lake County with nearby schools including A.J. Winters Elementary School and Bear Lake High School.
Ownership History
Date
Name
Owned For
Owner Type
Purchase Details
Closed on
Dec 30, 2020
Sold by
Cheney Diana M
Bought by
Kearney Kenneth Brett and Deoliveira Kearney Marisa
Current Estimated Value
Home Financials for this Owner
Home Financials are based on the most recent Mortgage that was taken out on this home.
Original Mortgage
$261,250
Outstanding Balance
$233,126
Interest Rate
2.7%
Mortgage Type
New Conventional
Estimated Equity
$141,421
Purchase Details
Closed on
Nov 2, 2020
Sold by
Cheney Diana M and Estate Of Delar B Cheney
Bought by
Kearney Kenneth Brett and Deoliveira Kearney Marisa
Home Financials for this Owner
Home Financials are based on the most recent Mortgage that was taken out on this home.
Original Mortgage
$261,250
Outstanding Balance
$233,126
Interest Rate
2.7%
Mortgage Type
New Conventional
Estimated Equity
$141,421
Purchase Details
Closed on
Oct 3, 2006
Sold by
Cheney Delar B
Bought by
Cheney Delar B and Cheney Diana M
Create a Home Valuation Report for This Property
The Home Valuation Report is an in-depth analysis detailing your home's value as well as a comparison with similar homes in the area
Home Values in the Area
Average Home Value in this Area
Purchase History
| Date | Buyer | Sale Price | Title Company |
|---|---|---|---|
| Kearney Kenneth Brett | -- | Northern Title Co | |
| Kearney Kenneth Brett | -- | Northern Title Co | |
| Cheney Delar B | -- | -- |
Source: Public Records
Mortgage History
| Date | Status | Borrower | Loan Amount |
|---|---|---|---|
| Open | Kearney Kenneth Brett | $261,250 |
Source: Public Records
Tax History Compared to Growth
Tax History
| Year | Tax Paid | Tax Assessment Tax Assessment Total Assessment is a certain percentage of the fair market value that is determined by local assessors to be the total taxable value of land and additions on the property. | Land | Improvement |
|---|---|---|---|---|
| 2025 | $1,445 | $342,515 | $21,475 | $321,040 |
| 2024 | $1,445 | $352,989 | $31,179 | $321,810 |
| 2023 | $1,422 | $358,228 | $79,588 | $278,640 |
| 2022 | $1,549 | $348,823 | $79,588 | $269,235 |
| 2021 | $892 | $237,204 | $55,734 | $181,470 |
| 2020 | $932 | $202,354 | $46,444 | $155,910 |
| 2019 | $921 | $200,774 | $46,444 | $154,330 |
| 2018 | $887 | $194,574 | $46,444 | $148,130 |
| 2017 | $884 | $190,104 | $46,444 | $143,660 |
| 2016 | $896 | $190,214 | $46,444 | $143,770 |
| 2015 | $875 | $336,804 | $191,624 | $145,180 |
| 2014 | $861 | $174,234 | $46,444 | $127,790 |
| 2010 | -- | $163,640 | $48,930 | $114,710 |
Source: Public Records
Map
Nearby Homes
- 302 4th S
- 4462 Dingle Rd
- 4040 Dingle Rd
- 74 Hunter Hill Rd
- 3400 E Sugar Loaf Rd E Unit NA
- 3400 Sugarloaf Rd
- 576 E Shore Rd
- 295 E 2nd St N
- 270 N 50 E
- 52 E 1st St S
- TBD U S Highway 89
- 102 S Main St
- 52 S Main St
- 20086 U S 30
- 0 U S Highway 89
- 357 W 3rd St N
- 59 W 1st S
- 225 W 1st N Unit 9
- 500 W 2nd N
- 268 S 4th St
- 600 Cemetary Rd
- 636 Cemetary Rd
- 500 Cemetary Rd
- 362 Cemetary Rd
- 362 Cemetary Rd
- 101 Cemetery Rd
- 178 Cemetary Rd
- 500 Horse Channel Rd
- 252 4th St
- 5106 Dingle Rd Unit 5
- 5200 Dingle Rd
- 5082 Dingle Rd
- 5256 Dingle Rd
- 5256 Dingle Rd Unit 2
- 5038 Dingle Rd
- 4854 Dingle Rd
- 4672 Dingle Rd
- 5522 Dingle Rd
- 4652 Dingle Rd
- 4733 Dingle Rd