Estimated payment $3,440/month
Highlights
- Deck
- Traditional Architecture
- Hydromassage or Jetted Bathtub
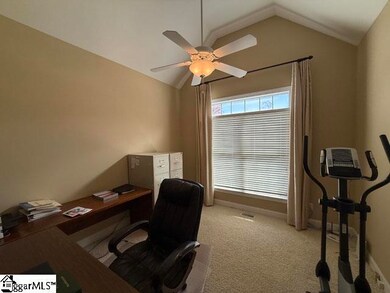
- Vaulted Ceiling
- Wood Flooring
- Corner Lot
About This Home
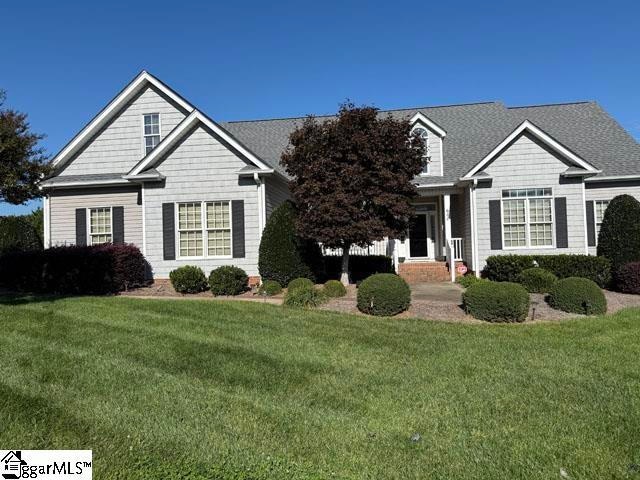
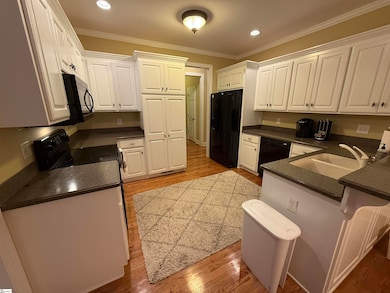
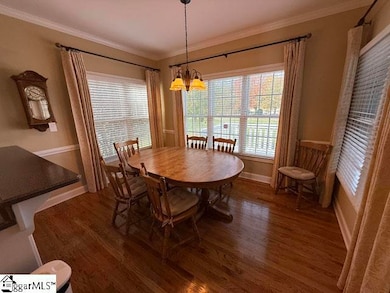
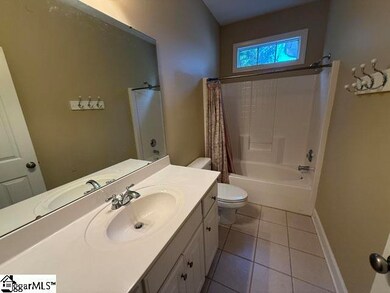
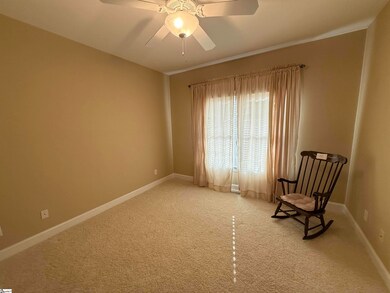
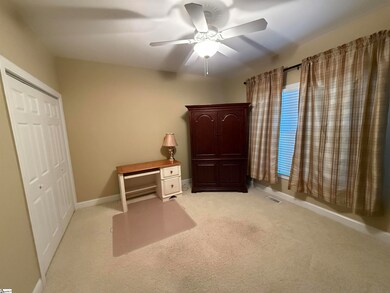
Welcome to 600 Dills Farm Way—a well-maintained home located in the desirable Silver Ridge Farms subdivision of Greer. This spacious single-family home features four bedrooms and two-and-a-half bathrooms across approximately 2,519 square feet. You will love the landscaped corner lot that has been meticulously maintained. Step inside to the open floor plan, solid, hardwood flooring throughout the main living areas. The formal dining room features chair rail and trey ceiling. The Kitchen has an ample supply of cabinetry with a pantry cabinet with pull-out drawers, Corian countertops, and a breakfast room. The living room features vaulted ceilings and a palladium window. The large primary bedroom with a 5-piece bath with jetted tub and a large, walk-in closet with shelving and a window. Walk-in laundry room with cabinetry and sink. Other features include: central vacuum system, tankless water heater, new ductwork in the crawlspace, large shop building with overhead door, side door, and electric power, screen porch, and wood deck. Square footage & measurements approximate. Buyer/Buyers agent must verify all information in MLS.
Home Details
Home Type
- Single Family
Est. Annual Taxes
- $1,696
Lot Details
- 0.83 Acre Lot
- Corner Lot
HOA Fees
- $11 Monthly HOA Fees
Home Design
- Traditional Architecture
- Composition Roof
- Vinyl Siding
Interior Spaces
- 2,400-2,599 Sq Ft Home
- 1.5-Story Property
- Vaulted Ceiling
- Gas Log Fireplace
- Insulated Windows
- Living Room
- Breakfast Room
- Dining Room
- Screened Porch
- Crawl Space
- Storage In Attic
Kitchen
- Electric Oven
- Built-In Microwave
- Dishwasher
- Solid Surface Countertops
Flooring
- Wood
- Carpet
- Ceramic Tile
Bedrooms and Bathrooms
- 4 Bedrooms | 3 Main Level Bedrooms
- Split Bedroom Floorplan
- Walk-In Closet
- 2.5 Bathrooms
- Hydromassage or Jetted Bathtub
Laundry
- Laundry Room
- Laundry on main level
Parking
- 2 Car Attached Garage
- Workshop in Garage
Outdoor Features
- Deck
- Outbuilding
Schools
- Chandler Creek Elementary School
- Greer Middle School
- Greer High School
Utilities
- Forced Air Heating and Cooling System
- Heating System Uses Natural Gas
- Underground Utilities
- Tankless Water Heater
- Septic Tank
Community Details
- Silver Ridge Farms Subdivision
- Mandatory home owners association
Listing and Financial Details
- Assessor Parcel Number T021.07-01-024.00
Map
Home Values in the Area
Average Home Value in this Area
Tax History
| Year | Tax Paid | Tax Assessment Tax Assessment Total Assessment is a certain percentage of the fair market value that is determined by local assessors to be the total taxable value of land and additions on the property. | Land | Improvement |
|---|---|---|---|---|
| 2024 | $1,696 | $12,250 | $1,980 | $10,270 |
| 2023 | $1,696 | $12,250 | $1,980 | $10,270 |
| 2022 | $1,582 | $12,250 | $1,980 | $10,270 |
| 2021 | $1,565 | $12,250 | $1,980 | $10,270 |
| 2020 | $1,399 | $10,650 | $1,720 | $8,930 |
| 2019 | $1,391 | $10,650 | $1,720 | $8,930 |
| 2018 | $1,387 | $10,650 | $1,720 | $8,930 |
| 2017 | $1,354 | $10,650 | $1,720 | $8,930 |
| 2016 | $1,299 | $266,350 | $43,000 | $223,350 |
| 2015 | $1,299 | $266,350 | $43,000 | $223,350 |
| 2014 | $1,347 | $275,520 | $43,000 | $232,520 |
Property History
| Date | Event | Price | List to Sale | Price per Sq Ft |
|---|---|---|---|---|
| 11/03/2025 11/03/25 | For Sale | $625,000 | -- | $260 / Sq Ft |
Purchase History
| Date | Type | Sale Price | Title Company |
|---|---|---|---|
| Interfamily Deed Transfer | -- | None Available | |
| Deed | $289,500 | -- | |
| Deed | $269,000 | -- | |
| Deed | $290,000 | None Available | |
| Interfamily Deed Transfer | -- | None Available | |
| Deed | $35,000 | -- |
Mortgage History
| Date | Status | Loan Amount | Loan Type |
|---|---|---|---|
| Previous Owner | $100,000 | New Conventional |
Source: Greater Greenville Association of REALTORS®
MLS Number: 1573827
APN: T021.07-01-024.00
Disclaimer: Certain information contained herein is derived from information provided by parties other than Homes.com. All information provided is deemed reliable, but is not guaranteed to be accurate and should be independently verified.
![]() IDX information is provided exclusively for personal, non-commercial use, and may not be used for any purpose other than to identify prospective properties consumers may be interested in purchasing. Information is deemed reliable but not guaranteed.
IDX information is provided exclusively for personal, non-commercial use, and may not be used for any purpose other than to identify prospective properties consumers may be interested in purchasing. Information is deemed reliable but not guaranteed.
- 2291 N Highway 101
- 800 Mountain View Ct Unit B
- 23 Annika Ct
- 507b W McElhaney Rd
- 2 Tiny Home Cir
- 206 Hillside Dr
- 140 Grove Point
- 401 Elizabeth Sarah Blvd
- 24 Tidworth Dr
- 6 Tidworth Dr
- 1102 W Poinsett St
- 439 S Buncombe Rd
- 30 Brooklet Trail
- 108 Fuller St Unit ID1234791P
- 201 Kramer Ct
- 138 Spring St Unit ID1234774P
- 36 Jones Creek Cir
- 101 Chandler Rd
- 300 Connecticut Ave
- 117 Pine St
