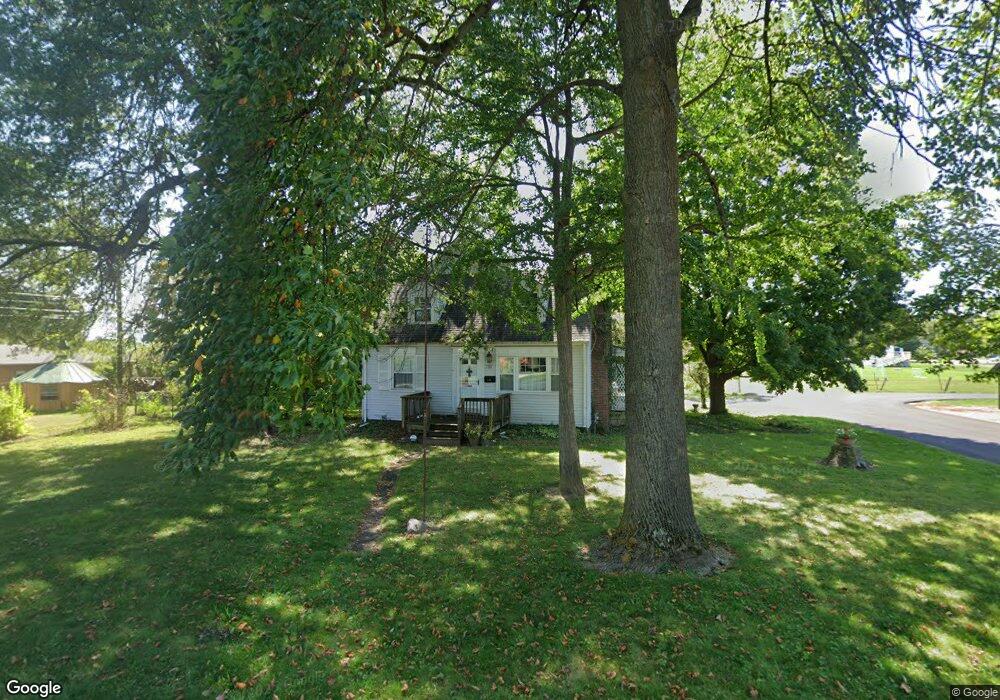
600 E 2nd St Sheridan, IN 46069
Estimated Value: $246,000 - $275,000
About This Home
This home is located at 600 E 2nd St, Sheridan, IN 46069 and is currently estimated at $259,581, approximately $125 per square foot. 600 E 2nd St is a home located in Hamilton County with nearby schools including Sheridan Elementary School, Sheridan Middle School, and Sheridan High School.
Ownership History
We collect this data history from publicly available records. To have your information removed, we recommend requesting removal directly through your county’s website.
Purchase Details
Purchase Details
Home Financials for this Owner
Home Financials are based on the most recent Mortgage that was taken out on this home.Home Values in the Area
Average Home Value in this Area
Purchase History
We collect this data history from publicly available records. To have your information removed, we recommend requesting removal directly through your county’s website.
| Date | Buyer | Sale Price | Title Company |
|---|---|---|---|
| -- | None Available | ||
| -- | None Available | ||
| -- | Nations Title |
Mortgage History
We collect this data history from publicly available records. To have your information removed, we recommend requesting removal directly through your county’s website.
| Date | Status | Borrower | Loan Amount |
|---|---|---|---|
| Closed | $61,801 |
Tax History
We collect this data history from publicly available records. To have your information removed, we recommend requesting removal directly through your county’s website.
| Year | Tax Paid | Tax Assessment Tax Assessment Total Assessment is a certain percentage of the fair market value that is determined by local assessors to be the total taxable value of land and additions on the property. | Land | Improvement |
|---|---|---|---|---|
| 2025 | $1,855 | $182,400 | $42,800 | $139,600 |
| 2024 | $1,739 | $160,900 | $42,800 | $118,100 |
| 2023 | $1,764 | $157,500 | $42,800 | $114,700 |
| 2022 | $1,697 | $147,100 | $42,800 | $104,300 |
| 2021 | $1,595 | $138,300 | $42,800 | $95,500 |
| 2020 | $1,520 | $131,900 | $42,800 | $89,100 |
| 2019 | $1,410 | $122,400 | $17,900 | $104,500 |
| 2018 | $1,335 | $116,000 | $17,900 | $98,100 |
| 2017 | $1,245 | $108,200 | $17,900 | $90,300 |
| 2016 | $1,296 | $115,000 | $17,900 | $97,100 |
| 2014 | $1,172 | $109,300 | $30,400 | $78,900 |
| 2013 | $1,172 | $106,000 | $30,400 | $75,600 |
Map
- 514 E 2nd St
- 108 W 3rd St
- 1012 Park Place Unit D
- 100 S Blake St
- 307 N Blake St
- 103 Elm Ave
- 24473 Godby St
- 24443 Godby St
- 24449 Godby St
- 24431 Godby St
- 707 S Hamilton Ave
- 24510 Godby St
- 1107 S Opel St
- 1141 S Malott St
- 407 W 8th St
- 0 Lamong Rd Unit MBR22102969
- 520 W 4th St
- 1004 Maple Run Dr
- 1115 Maple Run Dr
- 1134 Maple Trace Way
Ask me questions while you tour the home.