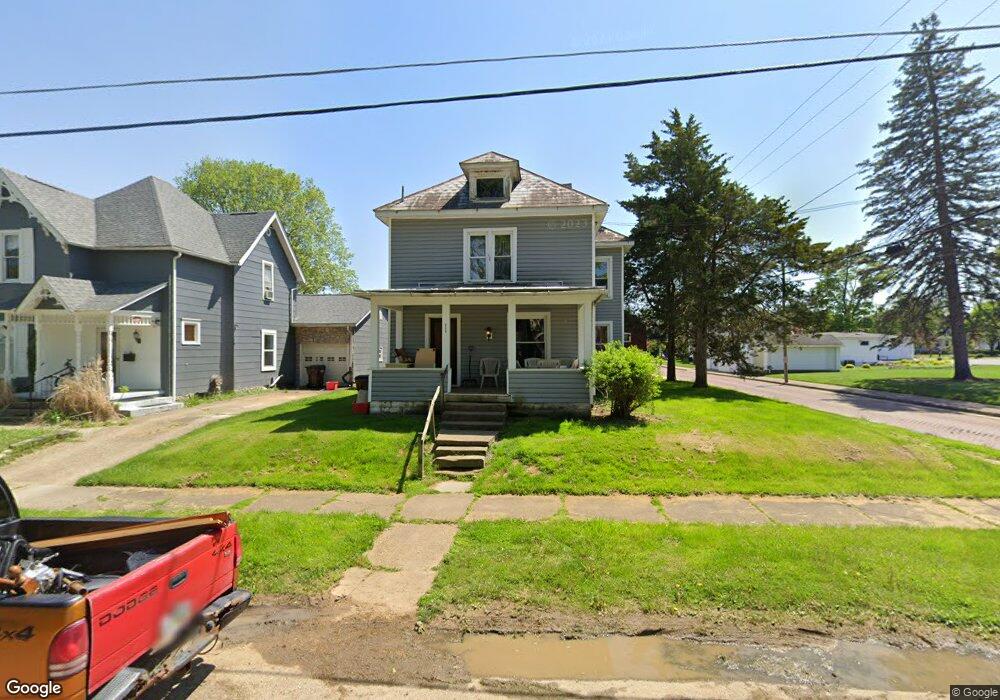
600 E Chestnut St Unit 1 Mount Vernon, OH 43050
Estimated Value: $242,000 - $281,000
2
Beds
2
Baths
900
Sq Ft
$291/Sq Ft
Est. Value
About This Home
This home is located at 600 E Chestnut St Unit 1, Mount Vernon, OH 43050 and is currently estimated at $261,537, approximately $290 per square foot. 600 E Chestnut St Unit 1 is a home located in Knox County with nearby schools including Mount Vernon High School, St. Vincent de Paul School, and Christian Star Academy.
Ownership History
Date
Name
Owned For
Owner Type
Purchase Details
Closed on
Oct 12, 2018
Sold by
Snyder Destiny L and Snyder Michael K
Bought by
Cooper Rebecca A
Current Estimated Value
Home Financials for this Owner
Home Financials are based on the most recent Mortgage that was taken out on this home.
Original Mortgage
$130,591
Outstanding Balance
$115,640
Interest Rate
5.25%
Mortgage Type
FHA
Estimated Equity
$145,897
Purchase Details
Closed on
Sep 9, 2016
Sold by
May Monica
Bought by
Snyder Destiny L
Purchase Details
Closed on
Oct 28, 2014
Sold by
Estate Of Harold D Kinnard
Bought by
Kinnard Anna M
Purchase Details
Closed on
Jan 1, 1987
Bought by
Kinnard Kinnard H and Kinnard Anna M
Create a Home Valuation Report for This Property
The Home Valuation Report is an in-depth analysis detailing your home's value as well as a comparison with similar homes in the area
Home Values in the Area
Average Home Value in this Area
Purchase History
| Date | Buyer | Sale Price | Title Company |
|---|---|---|---|
| Cooper Rebecca A | -- | -- | |
| Snyder Destiny L | $61,000 | None Available | |
| Kinnard Anna M | -- | None Available | |
| Kinnard Kinnard H | -- | -- |
Source: Public Records
Mortgage History
| Date | Status | Borrower | Loan Amount |
|---|---|---|---|
| Open | Cooper Rebecca A | $130,591 |
Source: Public Records
Property History
| Date | Event | Price | List to Sale | Price per Sq Ft |
|---|---|---|---|---|
| 11/29/2024 11/29/24 | Off Market | $900 | -- | -- |
| 11/21/2024 11/21/24 | For Rent | $900 | -- | -- |
Tax History
| Year | Tax Paid | Tax Assessment Tax Assessment Total Assessment is a certain percentage of the fair market value that is determined by local assessors to be the total taxable value of land and additions on the property. | Land | Improvement |
|---|---|---|---|---|
| 2024 | $2,213 | $58,670 | $6,560 | $52,110 |
| 2023 | $2,263 | $58,670 | $6,560 | $52,110 |
| 2022 | $1,990 | $46,940 | $5,250 | $41,690 |
| 2021 | $1,990 | $46,940 | $5,250 | $41,690 |
| 2020 | $1,938 | $46,940 | $5,250 | $41,690 |
| 2019 | $1,245 | $28,060 | $7,080 | $20,980 |
| 2018 | $1,245 | $28,060 | $7,080 | $20,980 |
| 2017 | $1,223 | $28,060 | $7,080 | $20,980 |
| 2016 | $754 | $25,980 | $6,560 | $19,420 |
| 2015 | $758 | $25,980 | $6,560 | $19,420 |
| 2014 | $762 | $25,980 | $6,560 | $19,420 |
| 2013 | $771 | $25,280 | $6,820 | $18,460 |
Source: Public Records
Map
Nearby Homes
- 600 1/2 E Chestnut St
- 600 E Chestnut St Unit 1/2
- 220 Coshocton Ave
- 213 Coshocton Ave
- 108 Ringold St
- 418 E Pleasant St
- 104 N Park St
- 501 Oak St
- 604 E Gambier St
- 655 Howard St
- 419 E Pleasant St
- 900 E Gambier St
- 208 E Burgess St
- 612 N Clinton St
- 1 Hilltop Dr
- 12 3rd Ave
- 12 Third Ave
- 6 Elliott St
- 0 Miami St
- 102 E Gambier St
- 600 E Chestnut St
- 600 E Chestnut St
- 602 E Chestnut St
- 601 E Chestnut St
- 606 E Chestnut St
- 703 E High St
- 603 E Chestnut St
- 705 E High St
- 605 E Chestnut St
- 523 E Chestnut St
- 104 N Catherine St
- 707 E High St
- 607 E Chestnut St
- 521 E Chestnut St
- Lot A E High St
- 608 E Chestnut St
- 514 E Chestnut St
- 514 E Chestnut St Unit 2
- 108 N Catherine St
- 709 E High St
Your Personal Tour Guide
Ask me questions while you tour the home.