Estimated Value: $274,169 - $300,000
3
Beds
2
Baths
1,847
Sq Ft
$155/Sq Ft
Est. Value
About This Home
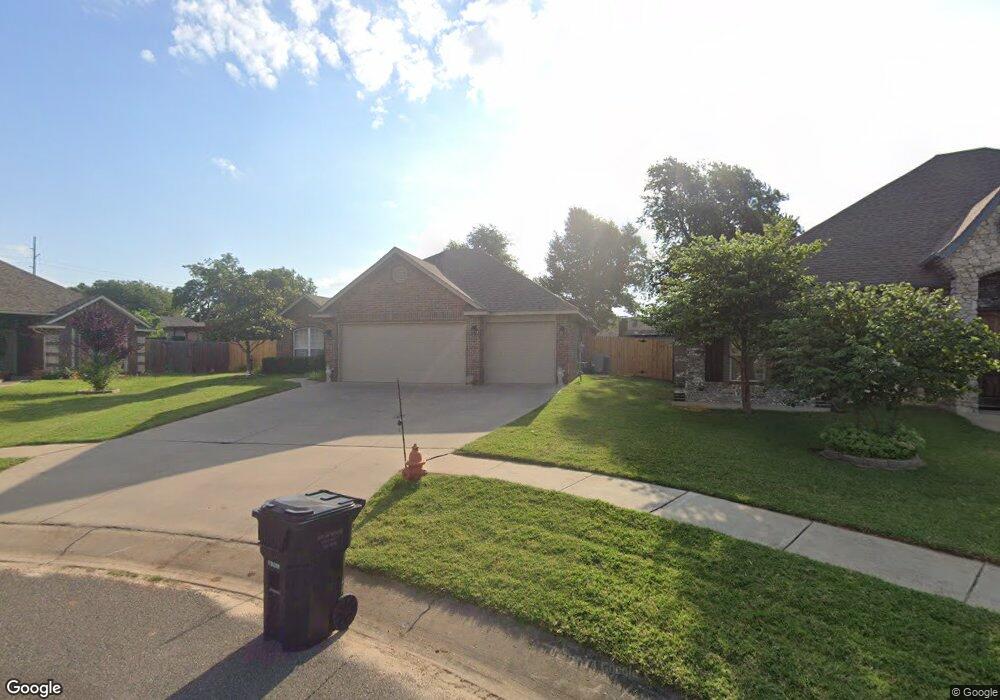
This home is located at 600 Eastmoor Ct, Moore, OK 73160 and is currently estimated at $286,792, approximately $155 per square foot. 600 Eastmoor Ct is a home located in Cleveland County with nearby schools including Apple Creek Elementary School, Highland East Junior High School, and Moore High School.
Ownership History
Date
Name
Owned For
Owner Type
Purchase Details
Closed on
Nov 14, 2017
Sold by
Hunt Elizabeth and Kelly Ronda
Bought by
Kelly Ronda
Current Estimated Value
Purchase Details
Closed on
Oct 16, 2014
Sold by
Merrell James David and Merrell Paulia Jean
Bought by
Merrell James D and Revoc Paulia
Purchase Details
Closed on
Dec 13, 2013
Sold by
Box Paul
Bought by
Box Paul and Paul Box Trust
Purchase Details
Closed on
Aug 30, 2013
Sold by
Box Paul
Bought by
Merrell James David and Merrell Paulia Jean
Home Financials for this Owner
Home Financials are based on the most recent Mortgage that was taken out on this home.
Original Mortgage
$130,000
Interest Rate
4.42%
Mortgage Type
New Conventional
Purchase Details
Closed on
May 18, 2009
Sold by
G Culver Homes Llc
Bought by
Box Paul
Purchase Details
Closed on
Feb 1, 2008
Sold by
Homes By Terry Inc
Bought by
G Culver Homes Llc
Create a Home Valuation Report for This Property
The Home Valuation Report is an in-depth analysis detailing your home's value as well as a comparison with similar homes in the area
Home Values in the Area
Average Home Value in this Area
Purchase History
| Date | Buyer | Sale Price | Title Company |
|---|---|---|---|
| Kelly Ronda | -- | None Available | |
| Merrell James D | -- | None Available | |
| Box Paul | -- | None Available | |
| Merrell James David | -- | None Available | |
| Box Paul | $170,000 | None Available | |
| G Culver Homes Llc | $28,500 | None Available |
Source: Public Records
Mortgage History
| Date | Status | Borrower | Loan Amount |
|---|---|---|---|
| Previous Owner | Merrell James David | $130,000 |
Source: Public Records
Tax History
| Year | Tax Paid | Tax Assessment Tax Assessment Total Assessment is a certain percentage of the fair market value that is determined by local assessors to be the total taxable value of land and additions on the property. | Land | Improvement |
|---|---|---|---|---|
| 2025 | $3,130 | $25,560 | $5,735 | $19,825 |
| 2023 | $2,826 | $23,184 | $4,191 | $18,993 |
| 2022 | $2,731 | $22,080 | $4,567 | $17,513 |
| 2021 | $2,613 | $21,029 | $4,518 | $16,511 |
| 2020 | $2,489 | $20,027 | $2,698 | $17,329 |
| 2019 | $2,536 | $20,027 | $2,698 | $17,329 |
| 2018 | $2,536 | $20,028 | $2,699 | $17,329 |
| 2017 | $2,551 | $20,028 | $0 | $0 |
| 2016 | $2,569 | $20,028 | $2,699 | $17,329 |
| 2015 | $2,345 | $20,213 | $2,699 | $17,514 |
| 2014 | $2,308 | $19,434 | $2,699 | $16,735 |
Source: Public Records
Map
Nearby Homes
- 604 Eastmoor Ct
- 701 S Patterson Dr
- 608 S Patterson Dr
- 801 S Avery Dr
- 2097 S Eastern Ave
- 833 SE 9th St
- 708 S Avery Dr
- 813 S Avery St
- 1101 S Bouziden Dr
- 316 SE 6th St
- 317 SE 6th St
- 901 SE 12th St
- 1101 S English St
- 300 S English Dr
- 317 Stoneridge Dr
- 729 Saint Charles St
- 305 Golden Leaf Ct
- 401 SE 10th St
- 1105 Golden Leaf Dr
- 221 N English Dr
- 837 SE 5th Ct
- 601 S Silver Leaf Dr
- 608 Eastmoor Ct
- 513 S Silver Leaf Dr
- 833 SE 5th Ct
- 605 S Silver Leaf Dr
- 509 S Silver Leaf Dr
- 829 SE 5th Ct
- 828 SE 5th Ct
- 609 S Silver Leaf Dr
- 612 Eastmoor Ct
- 505 S Silver Leaf Dr
- 825 SE 5th Ct
- 824 SE 5th Ct
- 613 S Silver Leaf Dr
- 616 Eastmoor Ct
- 829 SE 6th St
- 617 S Silver Leaf Dr
- 501 S Silver Leaf Dr
- 600 S Silver Leaf Dr
Your Personal Tour Guide
Ask me questions while you tour the home.