


600 El Loro St Las Vegas, NV 89138
Summerlin NeighborhoodHighlights
- Private Pool
- Gated Community
- Walk-In Pantry
- Linda Rankin Givens Elementary School Rated 10
- Main Floor Bedroom
- Soaking Tub
About This Home
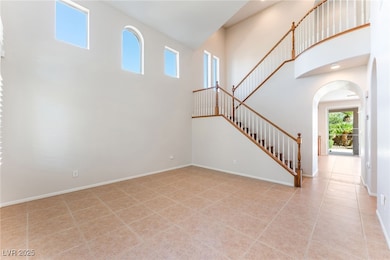
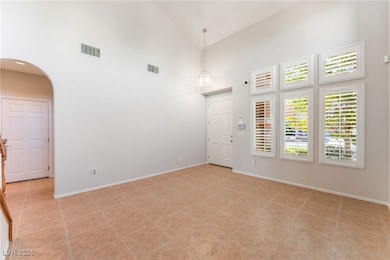
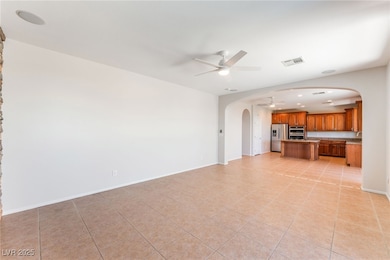
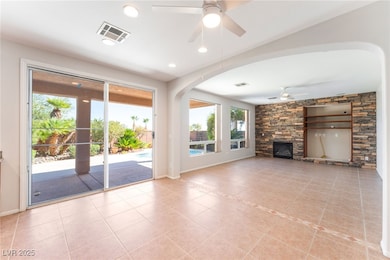
Step into this beautifully designed home featuring soaring ceilings and an abundance of natural light that enhances every room. Enjoy sleek, carpet-free flooring throughout, complemented by elegant shutters for added charm and privacy. The gourmet kitchen is a chef’s dream with a spacious island, granite countertops, stainless steel appliances, and a walk-in pantry. The family and dining rooms offer ceiling fans for year-round comfort, while the cozy fireplace adds a warm touch. A dedicated laundry room with a wash sink adds convenience. The primary suite boasts a private balcony with stunning views of the Strip, and the en-suite bath includes dual sinks, a standing shower, a separate soaking tub, and a generous walk-in closet. Additional bedrooms provide ample space for all your needs. Outside, a covered patio and sparkling pool create the perfect setting for relaxation or entertaining.
**POOL SERVICE, LANDSCAPING, AND TRASH/SEWER INCLUDED IN THE RENT AMOUNT**
Listing Agent
Black & Cherry Real Estate Brokerage Phone: 702-795-4663 License #B.0060116 Listed on: 10/24/2025
Home Details
Home Type
- Single Family
Est. Annual Taxes
- $3,782
Year Built
- Built in 2005
Lot Details
- 4,792 Sq Ft Lot
- East Facing Home
- Back Yard Fenced
- Block Wall Fence
Parking
- 2 Car Garage
Home Design
- Frame Construction
- Tile Roof
- Stucco
Interior Spaces
- 2,137 Sq Ft Home
- 2-Story Property
- Ceiling Fan
- Family Room with Fireplace
Kitchen
- Walk-In Pantry
- Gas Range
- Microwave
- Dishwasher
- Disposal
Flooring
- Carpet
- Linoleum
- Tile
- Vinyl
Bedrooms and Bathrooms
- 4 Bedrooms
- Main Floor Bedroom
- Soaking Tub
Laundry
- Laundry Room
- Washer and Dryer
Pool
- Private Pool
Schools
- Givens Elementary School
- Rogich Sig Middle School
- Palo Verde High School
Utilities
- Central Heating and Cooling System
- Heating System Uses Gas
- Cable TV Available
Listing and Financial Details
- Security Deposit $2,800
- Property Available on 10/22/25
- Tenant pays for electricity, gas, key deposit, trash collection, water
Community Details
Overview
- Property has a Home Owners Association
- Summerlin Association, Phone Number (702) 341-5500
- Solano At The Vistas Subdivision
- The community has rules related to covenants, conditions, and restrictions
Pet Policy
- No Pets Allowed
Security
- Gated Community
Map
Source: Las Vegas REALTORS®
MLS Number: 2729700
APN: 137-35-216-009
Disclaimer: Certain information contained herein is derived from information provided by parties other than Homes.com. All information provided is deemed reliable, but is not guaranteed to be accurate and should be independently verified.
![]() The data relating to real estate for sale on this web site comes in part from the INTERNET DATA EXCHANGE Program of the Greater Las Vegas Association of REALTORS® MLS. Real estate listings held by brokerage firms other than this site owner are marked with the IDX logo. Information is deemed reliable but not guaranteed. Copyright 2025 of the Greater Las Vegas Association of REALTORS® MLS. All rights reserved.
The data relating to real estate for sale on this web site comes in part from the INTERNET DATA EXCHANGE Program of the Greater Las Vegas Association of REALTORS® MLS. Real estate listings held by brokerage firms other than this site owner are marked with the IDX logo. Information is deemed reliable but not guaranteed. Copyright 2025 of the Greater Las Vegas Association of REALTORS® MLS. All rights reserved.
- 612 El Loro St
- 561 Tecate Valley St
- 529 Caribbean Palm Dr
- 11824 Amistoso Ln
- 11442 Crimson Ledge Ave
- 11832 Arenoso Dr
- 545 Ivy Spring St
- 873 Roseberry Dr
- 11904 Amistoso Ln
- 11832 Barcinas Ln
- 11620 Longhirst Hall Ln
- 624 Bachelor Button St
- 1991 Endless Song Dr
- 1504 Marsh Bird St
- 11784 Golden Moments Ave
- 11925 Luna Del Mar Ln
- 11425 Via Spiga Dr
- 929 Roseberry Dr
- 636 Chervil Valley Dr
- 12020 Prada Verde Dr
- 600 Delta Rio St
- 11625 Villa Malaparte Ave
- 11733 Costa Blanca Ave
- 721 Anacapri St
- 764 La Tosca St
- 11441 Valentino Ln
- 11832 Barcinas Ln
- 11908 Arenoso Dr
- 11921 Luna Del Mar Ln
- 858 La Sconsa Dr
- 536 Puenta Del Rey St
- 425 Ralph Mosa St
- 11830 Tevare Ln Unit 2064
- 912 Percy Arms St
- 840 Paseo Rocoso Place
- 384 Rancho Rosario Ct
- 11830 Portina Dr Unit 2031
- 11325 Via Spiga Dr
- 11835 Portina Dr Unit 2023
- 12057 La Palmera Ave
