Estimated Value: $243,521 - $277,000
3
Beds
2
Baths
1,704
Sq Ft
$154/Sq Ft
Est. Value
About This Home
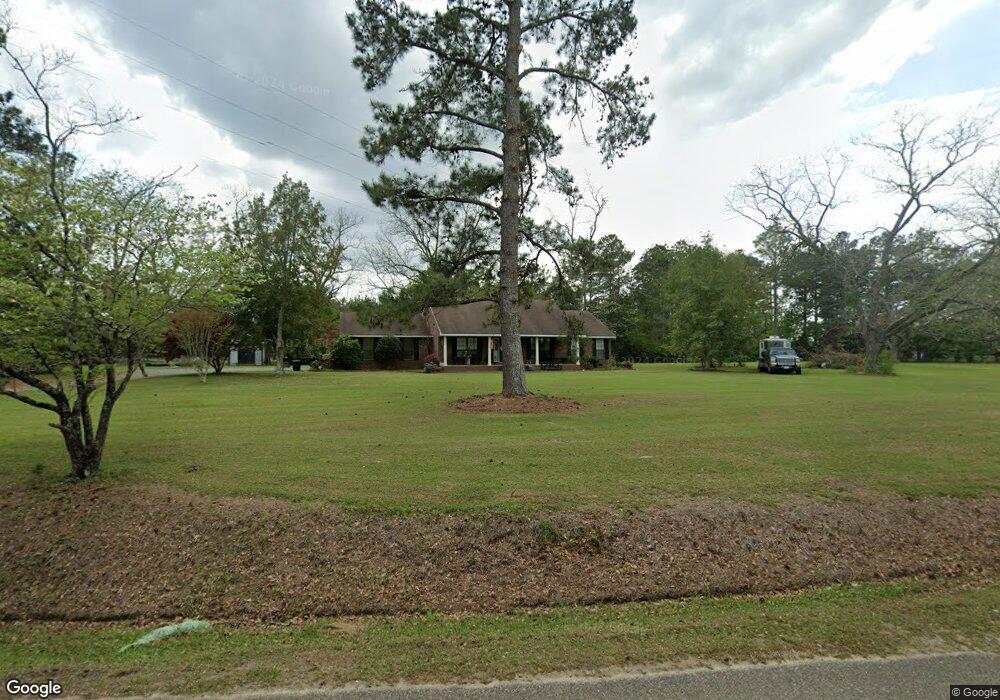
This home is located at 600 Elkins Rd, Cairo, GA 39827 and is currently estimated at $262,880, approximately $154 per square foot. 600 Elkins Rd is a home located in Grady County with nearby schools including Raev Academy.
Ownership History
Date
Name
Owned For
Owner Type
Purchase Details
Closed on
May 15, 2020
Sold by
Harvey Cynthia Lequita
Bought by
Cecil David Blake and Cecil Brandie Turner
Current Estimated Value
Home Financials for this Owner
Home Financials are based on the most recent Mortgage that was taken out on this home.
Original Mortgage
$141,000
Outstanding Balance
$124,946
Interest Rate
3.3%
Mortgage Type
New Conventional
Estimated Equity
$137,934
Purchase Details
Closed on
Apr 21, 2020
Sold by
Mcconnell Kenneth Robert
Bought by
Harvey Cynthia Lequita
Home Financials for this Owner
Home Financials are based on the most recent Mortgage that was taken out on this home.
Original Mortgage
$141,000
Outstanding Balance
$124,946
Interest Rate
3.3%
Mortgage Type
New Conventional
Estimated Equity
$137,934
Purchase Details
Closed on
Jun 7, 2018
Sold by
Mcconnell Louise
Bought by
Harvey Cynthia Lequita and Mcconnell Kenneth Robert
Purchase Details
Closed on
Dec 7, 1992
Bought by
Mcconnell Louise
Create a Home Valuation Report for This Property
The Home Valuation Report is an in-depth analysis detailing your home's value as well as a comparison with similar homes in the area
Home Values in the Area
Average Home Value in this Area
Purchase History
| Date | Buyer | Sale Price | Title Company |
|---|---|---|---|
| Cecil David Blake | $160,000 | -- | |
| Harvey Cynthia Lequita | -- | -- | |
| Harvey Cynthia Lequita | -- | -- | |
| Mcconnell Louise | -- | -- |
Source: Public Records
Mortgage History
| Date | Status | Borrower | Loan Amount |
|---|---|---|---|
| Open | Cecil David Blake | $141,000 |
Source: Public Records
Tax History Compared to Growth
Tax History
| Year | Tax Paid | Tax Assessment Tax Assessment Total Assessment is a certain percentage of the fair market value that is determined by local assessors to be the total taxable value of land and additions on the property. | Land | Improvement |
|---|---|---|---|---|
| 2024 | $2,560 | $85,208 | $6,355 | $78,853 |
| 2023 | $1,665 | $56,079 | $4,085 | $51,994 |
| 2022 | $1,665 | $56,079 | $4,085 | $51,994 |
| 2021 | $1,670 | $56,079 | $4,085 | $51,994 |
| 2020 | $1,738 | $56,079 | $4,085 | $51,994 |
| 2019 | $1,738 | $56,079 | $4,085 | $51,994 |
| 2018 | $1,573 | $56,079 | $4,085 | $51,994 |
| 2017 | $1,497 | $56,079 | $4,085 | $51,994 |
| 2016 | $1,304 | $48,820 | $4,085 | $44,735 |
| 2015 | $1,288 | $48,820 | $4,085 | $44,735 |
| 2014 | $1,290 | $48,820 | $4,085 | $44,735 |
| 2013 | -- | $45,107 | $5,697 | $39,410 |
Source: Public Records
Map
Nearby Homes
- 1016 Richter Rd
- 1210 Elkins Rd
- 3136 State Route 188
- 414 Woodland Rd
- 105 Woodridge Ln
- 2427 Pierce Chapel Rd
- 158 Woodridge Ln
- 00 State Route 188
- 0 State Route 188
- 264 Woodridge Ln
- 963 Pope's Store Rd
- 126 Banks Rd
- 0 NE Airport Rd Unit 145784
- 000 15th Ave Nw -- Tract 2
- 000 15th Ave Nw -- Tract 1
- 1420 Parallel Dr NW
- 1725 Tract 2 Hwy 84w
- 1725 Tract #1 Hwy 84w
- 00 NW 9th Ave
- 0 20th St NE