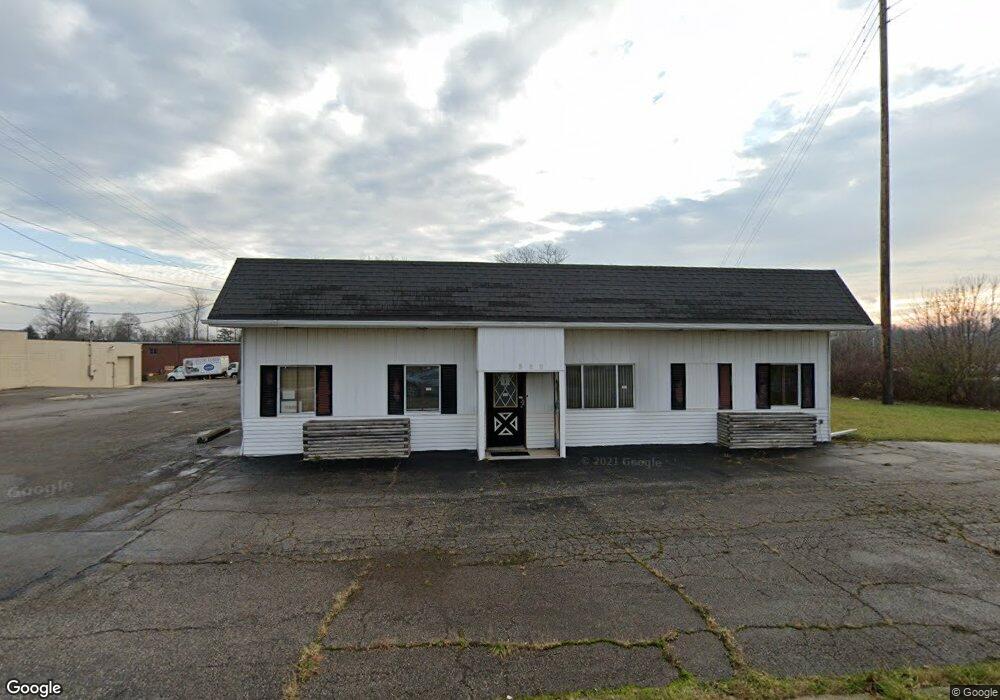
600 Home Rd N Mansfield, OH 44906
Estimated Value: $262,951
--
Bed
--
Bath
5,000
Sq Ft
$53/Sq Ft
Est. Value
About This Home
This home is located at 600 Home Rd N, Mansfield, OH 44906 and is currently estimated at $262,951, approximately $52 per square foot. 600 Home Rd N is a home located in Richland County with nearby schools including The Richland School of Academic Arts, Mansfield Elective Academy, and Goal Digital Academy.
Ownership History
Date
Name
Owned For
Owner Type
Purchase Details
Closed on
Sep 24, 2024
Sold by
Salj Holding Company Llc
Bought by
American Homestead Exteriors Llc
Current Estimated Value
Home Financials for this Owner
Home Financials are based on the most recent Mortgage that was taken out on this home.
Original Mortgage
$200,000
Outstanding Balance
$194,952
Interest Rate
6.49%
Mortgage Type
Credit Line Revolving
Estimated Equity
$67,999
Purchase Details
Closed on
Nov 29, 2022
Sold by
Offmiss Timothy M and Offmiss Toni J
Bought by
Salj Holding Company Llc
Home Financials for this Owner
Home Financials are based on the most recent Mortgage that was taken out on this home.
Original Mortgage
$168,000
Interest Rate
6.95%
Mortgage Type
Credit Line Revolving
Purchase Details
Closed on
Mar 1, 1993
Bought by
Offmiss Timothy M
Create a Home Valuation Report for This Property
The Home Valuation Report is an in-depth analysis detailing your home's value as well as a comparison with similar homes in the area
Home Values in the Area
Average Home Value in this Area
Purchase History
| Date | Buyer | Sale Price | Title Company |
|---|---|---|---|
| American Homestead Exteriors Llc | $250,000 | Southern Title | |
| American Homestead Exteriors Llc | $250,000 | Southern Title | |
| Salj Holding Company Llc | $210,000 | -- | |
| Offmiss Timothy M | $90,000 | -- |
Source: Public Records
Mortgage History
| Date | Status | Borrower | Loan Amount |
|---|---|---|---|
| Open | American Homestead Exteriors Llc | $200,000 | |
| Closed | American Homestead Exteriors Llc | $200,000 | |
| Previous Owner | Salj Holding Company Llc | $168,000 |
Source: Public Records
Tax History Compared to Growth
Tax History
| Year | Tax Paid | Tax Assessment Tax Assessment Total Assessment is a certain percentage of the fair market value that is determined by local assessors to be the total taxable value of land and additions on the property. | Land | Improvement |
|---|---|---|---|---|
| 2024 | $2,425 | $64,990 | $14,860 | $50,130 |
| 2023 | $4,619 | $64,990 | $14,860 | $50,130 |
| 2022 | $2,126 | $26,460 | $9,510 | $16,950 |
| 2021 | $2,136 | $26,460 | $9,510 | $16,950 |
| 2020 | $2,168 | $26,460 | $9,510 | $16,950 |
| 2019 | $2,268 | $26,460 | $9,510 | $16,950 |
| 2018 | $2,258 | $26,460 | $9,510 | $16,950 |
| 2017 | $2,215 | $26,460 | $9,510 | $16,950 |
| 2016 | $2,210 | $25,940 | $9,510 | $16,430 |
| 2015 | $2,210 | $25,940 | $9,510 | $16,430 |
| 2014 | $2,100 | $25,940 | $9,510 | $16,430 |
| 2012 | $868 | $25,940 | $9,510 | $16,430 |
Source: Public Records
Map
Nearby Homes
- 2585 Deerfield Ln
- 1496 W 4th St
- 720 Lindaire Ln E
- 1431 Silver Ln
- 204 Lasalle St
- 147 Wimbledon Dr
- 143 Buckeye Ave
- 99 Scotland Blvd
- 340 Boston Ave
- 1915 Teakwood Dr Unit 1915
- 1909 Teakwood Dr
- 1947 Teakwood Dr
- 0 W Fourth St - Trimble Lenox
- 175 Maple Ln
- 1996 Park Ave W
- 2007 Teakwood Dr
- 2010 Teakwood Dr
- 142 Grasmere Ave
- 1592 Walker Woods Blvd
- 405 Maple Ln Unit 405 & 407
- 557 Home Rd N
- 1590 W 4th St
- 1560 W 4th St
- 1544 W 4th St
- 373 Rhodes Ave
- 1616 W 4th St
- 1643 W 4th St
- 379 Rhodes Ave
- 0 Maplewood-Springbrook Unit 221989
- 0 Maplewood-Springbrook Unit 9045157
- 653 N Home Rd
- 376 Rhodes Ave
- 376 Rhodes Ave
- 0 Springbrook-Maplewood-trimble Unit 9045156
- 1653 W 4th St
- 519 Home Rd N
- 380 Rhodes Ave
- 373 On A Way Ave
- 379 On A Way Ave
- 398 Rhodes Ave