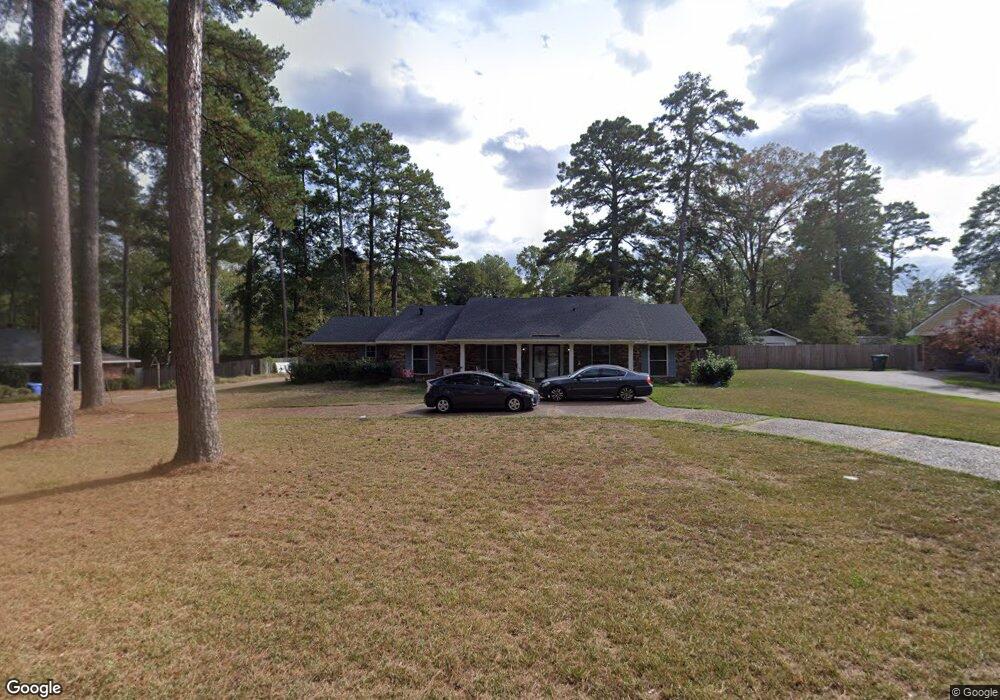
600 Hundred Oaks Dr Ruston, LA 71270
Estimated Value: $293,305 - $363,000
Studio
--
Bath
2,228
Sq Ft
$142/Sq Ft
Est. Value
About This Home
This home is located at 600 Hundred Oaks Dr, Ruston, LA 71270 and is currently estimated at $315,326, approximately $141 per square foot. 600 Hundred Oaks Dr is a home located in Lincoln Parish with nearby schools including Hillcrest Elementary School, Ruston Elementary School, and Ruston Junior High School.
Ownership History
Date
Name
Owned For
Owner Type
Purchase Details
Closed on
May 18, 2007
Sold by
The French Quaters Of Lincoln Llc
Bought by
Alexander Investment Properties Llc
Current Estimated Value
Home Financials for this Owner
Home Financials are based on the most recent Mortgage that was taken out on this home.
Original Mortgage
$300,000
Outstanding Balance
$231,957
Interest Rate
12%
Mortgage Type
Purchase Money Mortgage
Estimated Equity
$83,369
Purchase Details
Closed on
Oct 28, 2005
Sold by
Gleason Frazier Karen Leigh and Gleason James Henry
Bought by
Brown Alexander Eric Scott and Brown Alexander Holly Nicole
Home Financials for this Owner
Home Financials are based on the most recent Mortgage that was taken out on this home.
Original Mortgage
$250,000
Interest Rate
5.73%
Mortgage Type
Purchase Money Mortgage
Create a Home Valuation Report for This Property
The Home Valuation Report is an in-depth analysis detailing your home's value as well as a comparison with similar homes in the area
Purchase History
| Date | Buyer | Sale Price | Title Company |
|---|---|---|---|
| Alexander Investment Properties Llc | $35,000 | None Available | |
| Brown Alexander Eric Scott | $179,000 | None Available |
Source: Public Records
Mortgage History
| Date | Status | Borrower | Loan Amount |
|---|---|---|---|
| Open | Alexander Investment Properties Llc | $300,000 | |
| Previous Owner | Brown Alexander Eric Scott | $250,000 |
Source: Public Records
Tax History Compared to Growth
Tax History
| Year | Tax Paid | Tax Assessment Tax Assessment Total Assessment is a certain percentage of the fair market value that is determined by local assessors to be the total taxable value of land and additions on the property. | Land | Improvement |
|---|---|---|---|---|
| 2024 | $2,092 | $24,507 | $2,967 | $21,540 |
| 2023 | $1,954 | $21,990 | $3,210 | $18,780 |
| 2022 | $1,964 | $21,990 | $3,210 | $18,780 |
| 2021 | $1,818 | $21,990 | $3,210 | $18,780 |
| 2020 | $1,770 | $21,300 | $3,210 | $18,090 |
| 2019 | $1,730 | $21,300 | $3,210 | $18,090 |
| 2018 | $1,683 | $21,300 | $3,210 | $18,090 |
| 2017 | $1,687 | $21,300 | $3,210 | $18,090 |
| 2016 | $1,680 | $0 | $0 | $0 |
| 2015 | $1,625 | $18,919 | $3,072 | $15,847 |
| 2013 | $1,651 | $18,919 | $3,072 | $15,847 |
Source: Public Records
Map
Nearby Homes
- 704 Hundred Oaks Dr
- 3001 Belcara Dr
- 2408 Rhody Dr
- 503 E Kentucky Ave
- 1001 Chase Ln
- 402 E Kentucky Ave
- 2104 Greenbriar Dr
- 905 Tarreyton Dr
- 0 English Turn
- 2900 Post Oak Dr
- 521 Audubon Dr
- 910 Laura Ln
- 1715 N Trenton St
- Lot 5 Llangeler Dr
- 200 Pinecrest Dr
- 1607 N Trenton St
- 1604 N Trenton St
- 1709 Rampart Dr
- 2158 Llangeler Dr
- 3114 Canal St
- 510 Hundred Oaks Dr
- 602 Hundred Oaks Dr
- 500 Dayton Dr
- 601 Hundred Oaks Dr
- 502 Dayton Dr
- 508 Hundred Oaks Dr
- 604 Hundred Oaks Dr
- 501 Dayton Dr
- 603 Hundred Oaks Dr
- 2701 Belcara Dr
- 632 Zephyr Ln
- 605 Hundred Oaks Dr
- 2509 Briarhill Dr
- 506 Hundred Oaks Dr
- 504 Dayton Dr
- 624 Zephyr Ln
- 503 Dayton Dr
- 700 Hundred Oaks Dr
- 2703 Belcara Dr
- 2704 Belcara Dr