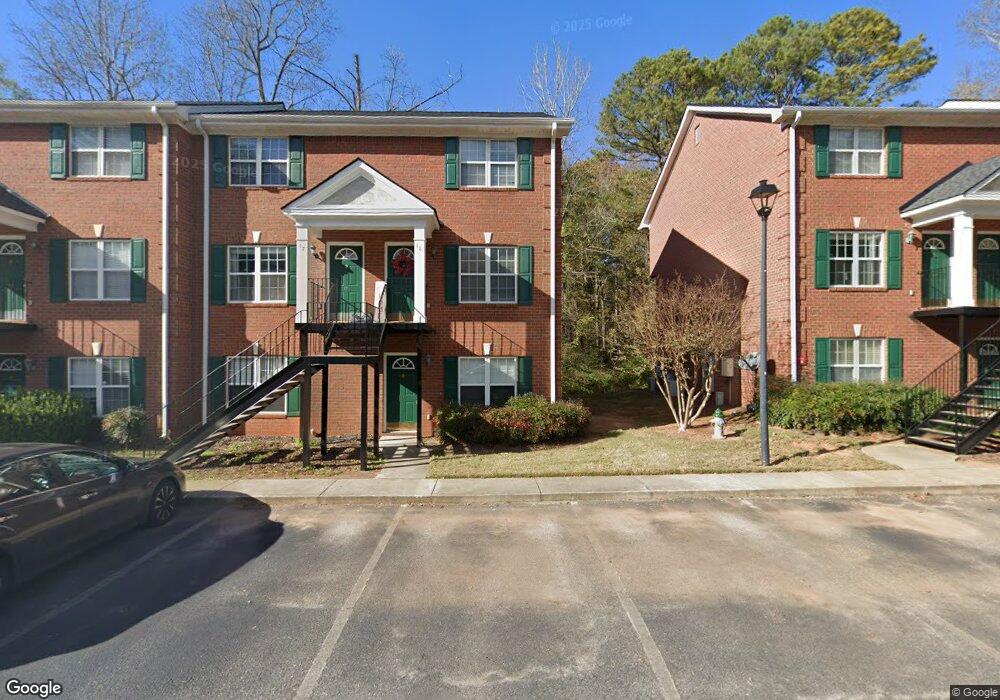
600 Mitchell Bridge Rd Athens, GA 30606
Estimated Value: $196,000 - $247,000
--
Bed
2
Baths
1,275
Sq Ft
$171/Sq Ft
Est. Value
About This Home
This home is located at 600 Mitchell Bridge Rd, Athens, GA 30606 and is currently estimated at $217,538, approximately $170 per square foot. 600 Mitchell Bridge Rd is a home located in Clarke County with nearby schools including Oglethorpe Avenue Elementary School, Burney-Harris-Lyons Middle School, and Clarke Central High School.
Ownership History
Date
Name
Owned For
Owner Type
Purchase Details
Closed on
Aug 28, 2008
Sold by
Day Kathleen M
Bought by
Adams Thomas B
Current Estimated Value
Home Financials for this Owner
Home Financials are based on the most recent Mortgage that was taken out on this home.
Original Mortgage
$97,650
Outstanding Balance
$64,293
Interest Rate
6.48%
Mortgage Type
New Conventional
Estimated Equity
$153,245
Purchase Details
Closed on
Jul 22, 2005
Sold by
Waters D Davis
Bought by
Schabel Kathleen M
Home Financials for this Owner
Home Financials are based on the most recent Mortgage that was taken out on this home.
Original Mortgage
$116,109
Interest Rate
5.51%
Mortgage Type
FHA
Purchase Details
Closed on
Feb 4, 2004
Sold by
Waters D Davis Janice D Waters
Bought by
Davis Waters D and Waters Mary Ellen B
Purchase Details
Closed on
Jun 6, 2002
Sold by
Floyd & Floyd Enterprises Inc
Bought by
Waters D Davis Janice D Waters
Create a Home Valuation Report for This Property
The Home Valuation Report is an in-depth analysis detailing your home's value as well as a comparison with similar homes in the area
Home Values in the Area
Average Home Value in this Area
Purchase History
| Date | Buyer | Sale Price | Title Company |
|---|---|---|---|
| Adams Thomas B | $108,500 | -- | |
| Schabel Kathleen M | $119,700 | -- | |
| Davis Waters D | -- | -- | |
| Waters D Davis Janice D Waters | $103,900 | -- |
Source: Public Records
Mortgage History
| Date | Status | Borrower | Loan Amount |
|---|---|---|---|
| Open | Adams Thomas B | $97,650 | |
| Previous Owner | Schabel Kathleen M | $116,109 |
Source: Public Records
Tax History Compared to Growth
Tax History
| Year | Tax Paid | Tax Assessment Tax Assessment Total Assessment is a certain percentage of the fair market value that is determined by local assessors to be the total taxable value of land and additions on the property. | Land | Improvement |
|---|---|---|---|---|
| 2025 | $1,391 | $89,018 | $8,000 | $81,018 |
| 2024 | $1,391 | $85,980 | $8,000 | $77,980 |
| 2023 | $290 | $81,577 | $8,000 | $73,577 |
| 2022 | $1,223 | $54,204 | $8,000 | $46,204 |
| 2021 | $1,186 | $46,564 | $8,000 | $38,564 |
| 2020 | $1,155 | $44,271 | $8,000 | $36,271 |
| 2019 | $1,067 | $41,424 | $8,000 | $33,424 |
| 2018 | $828 | $34,392 | $8,000 | $26,392 |
| 2017 | $815 | $34,013 | $8,000 | $26,013 |
| 2016 | $681 | $30,061 | $8,000 | $22,061 |
| 2015 | $879 | $35,839 | $8,000 | $27,839 |
| 2014 | $891 | $36,152 | $8,000 | $28,152 |
Source: Public Records
Map
Nearby Homes
- 275 Westchester Cir
- 105 Westchester Dr Unit A8
- 105 Westchester Dr Unit A8
- 105 Westchester Dr Unit E5
- 809 Forest Heights Dr
- 104 Westchester Cir Unit 4
- 225 Sherwood Dr
- 379 Chalfont Dr
- 377 Chalfont Dr
- 135 Tara Way
- 369 Westchester Dr
- 43 River Shoals Dr
- 330 Stoneland Dr
- 124 Pin Oak Ct
- 140 Breckenridge Ln
- 125 Mitchell Bluff
- 205 Tremont Cir
- 185 Landor Dr
- 114 Kara Dr
- 600 Mitchell Bridge Rd Unit 17
- 600 Mitchell Bridge Rd Unit 21
- 600 Mitchell Bridge Rd Unit 22
- 600 Mitchell Bridge Rd Unit 10
- 600 Mitchell Bridge Rd Unit 5
- 600 Mitchell Bridge Rd Unit 4
- 600 Mitchell Bridge Rd Unit 1
- 600 Mitchell Bridge Rd Unit 7
- 600 Mitchell Bridge Rd Unit 24
- 600 Mitchell Bridge Rd Unit 23
- 600 Mitchell Bridge Rd Unit 26
- 600 Mitchell Bridge Rd Unit Boulder Creek
- 600 Mitchell Bridge Rd
- 600 Mitchell Bridge Rd Unit 27
- 600 Mitchell Bridge Rd Unit 19
- 600 Mitchell Bridge Rd Unit 8
- 600 Mitchell Bridge Rd Unit 9
- 600 Mitchell Bridge Rd
- 600 Mitchell Bridge Rd
- 600 Mitchell Bridge Rd