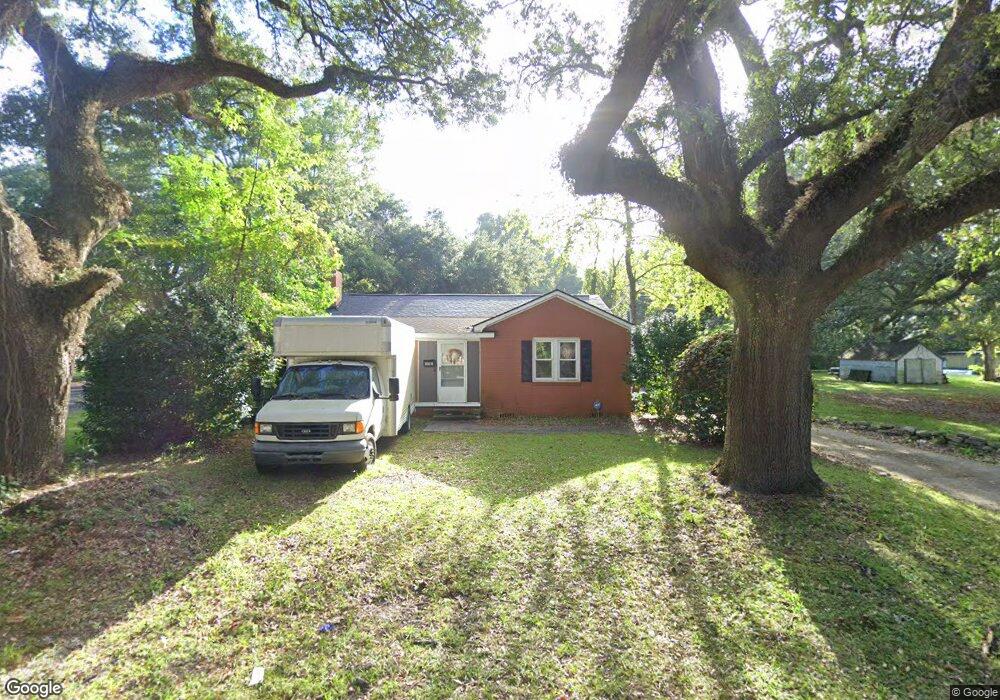
600 N Congdon St Georgetown, SC 29440
Estimated Value: $136,000 - $167,353
3
Beds
1
Bath
1,190
Sq Ft
$128/Sq Ft
Est. Value
About This Home
This home is located at 600 N Congdon St, Georgetown, SC 29440 and is currently estimated at $152,838, approximately $128 per square foot. 600 N Congdon St is a home located in Georgetown County with nearby schools including Kensington Elementary School, Georgetown Middle School, and Georgetown High School.
Ownership History
Date
Name
Owned For
Owner Type
Purchase Details
Closed on
May 17, 2006
Sold by
Shealy Carey W and Shealy Suzanne M
Bought by
Gardner Sonya
Current Estimated Value
Purchase Details
Closed on
Aug 1, 2005
Sold by
Demattia Andrew and Demattia Sandra L
Bought by
Shealy Carey W and Shealy Suzanne M
Home Financials for this Owner
Home Financials are based on the most recent Mortgage that was taken out on this home.
Original Mortgage
$66,400
Interest Rate
7%
Mortgage Type
Future Advance Clause Open End Mortgage
Purchase Details
Closed on
Mar 29, 2004
Sold by
Mccants Jimmy
Bought by
Demattia Sandra L and Demattia Andrew
Purchase Details
Closed on
Dec 19, 2002
Sold by
Emc Mortgage Corp
Bought by
Mccants Jimmy
Purchase Details
Closed on
Oct 30, 2002
Sold by
Brown John W and Brown Pamela C
Bought by
Emc Mtg Corp
Create a Home Valuation Report for This Property
The Home Valuation Report is an in-depth analysis detailing your home's value as well as a comparison with similar homes in the area
Home Values in the Area
Average Home Value in this Area
Purchase History
| Date | Buyer | Sale Price | Title Company |
|---|---|---|---|
| Gardner Sonya | $79,900 | None Available | |
| Shealy Carey W | $58,000 | -- | |
| Demattia Sandra L | $56,000 | -- | |
| Mccants Jimmy | $41,000 | -- | |
| Emc Mtg Corp | $38,250 | -- |
Source: Public Records
Mortgage History
| Date | Status | Borrower | Loan Amount |
|---|---|---|---|
| Previous Owner | Shealy Carey W | $66,400 |
Source: Public Records
Tax History Compared to Growth
Tax History
| Year | Tax Paid | Tax Assessment Tax Assessment Total Assessment is a certain percentage of the fair market value that is determined by local assessors to be the total taxable value of land and additions on the property. | Land | Improvement |
|---|---|---|---|---|
| 2024 | $640 | $2,500 | $430 | $2,070 |
| 2023 | $640 | $2,500 | $430 | $2,070 |
| 2022 | $564 | $2,500 | $430 | $2,070 |
| 2021 | $546 | $2,504 | $432 | $2,072 |
| 2020 | $545 | $2,504 | $432 | $2,072 |
| 2019 | $542 | $2,556 | $432 | $2,124 |
| 2018 | $551 | $25,560 | $0 | $0 |
| 2017 | $477 | $25,560 | $0 | $0 |
| 2016 | $469 | $2,556 | $0 | $0 |
| 2015 | $463 | $0 | $0 | $0 |
| 2014 | $463 | $61,800 | $10,800 | $51,000 |
| 2012 | -- | $61,800 | $10,800 | $51,000 |
Source: Public Records
Map
Nearby Homes
- 1306 Richmond Dr
- 902 Palm St
- 2478 N Fraser St Unit 12+ acres
- 1508 Duke St
- 1121 Grimes St
- 2405 & 2407 Highmarket St
- 910 Willowbank Rd
- 1137 Palmetto St
- 0 Rainey Dr
- 125 N Fraser St
- 1510 Front St
- 105 S Merriman Rd
- 105 S Merriman Rd Unit 1
- 1209 Prince St
- 1010 Highmarket St
- 133 Wood St
- 932 Duke St Unit Historic District of
- 1019 Prince St
- 811 Prince St Unit Historic District
- 815 Front St Unit 2H
- 606 N Congdon St
- 608 N Congdon St Unit Lot A - Dogwood
- 520 N Congdon St
- 518 N Congdon St
- 603 N Hazard St
- 610 N Congdon St
- 1702 Hampton St
- 607 N Hazard St
- 531 N Hazard St
- 517 N Congdon St
- 607 N Congdon St
- 605 N Congdon St
- 614 N Congdon St
- 529 N Hazard St
- 609 N Congdon St
- 515 N Congdon St
- 523 N Hazard St
- 611 N Hazard St
- 512 N Congdon St
- TBD N Congdon St