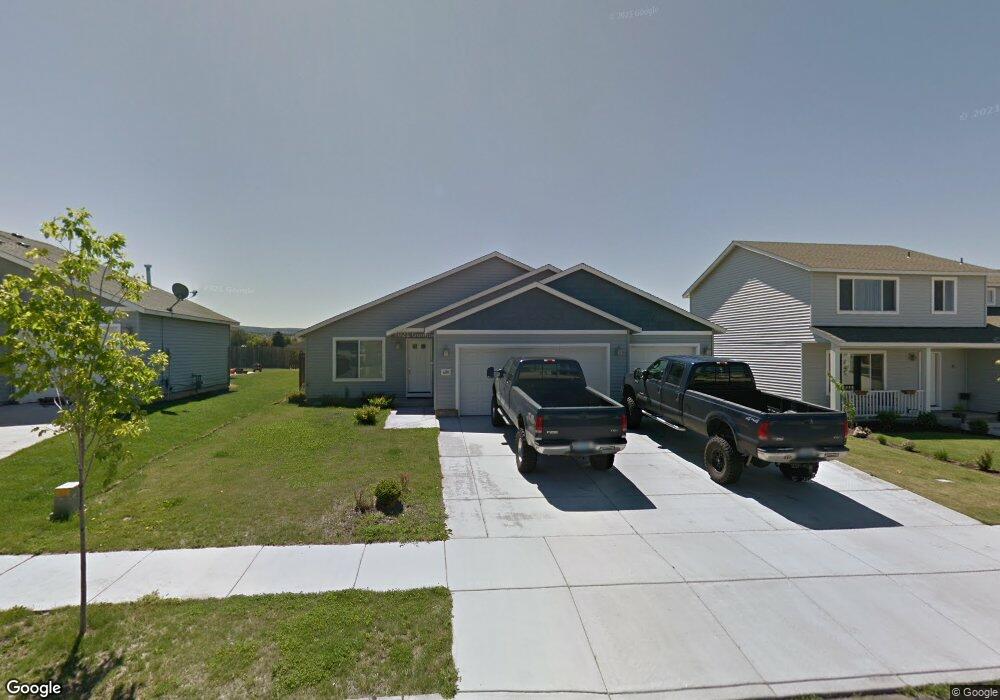
600 NE Robin Place Unit Lot27 Prineville, OR 97754
Estimated Value: $396,000 - $406,526
3
Beds
2
Baths
1,415
Sq Ft
$284/Sq Ft
Est. Value
About This Home
This home is located at 600 NE Robin Place Unit Lot27, Prineville, OR 97754 and is currently estimated at $401,263, approximately $283 per square foot. 600 NE Robin Place Unit Lot27 is a home located in Crook County with nearby schools including Crook County Middle School, Crook County High School, and Cascade Virtual Academy.
Ownership History
Date
Name
Owned For
Owner Type
Purchase Details
Closed on
Dec 8, 2021
Sold by
Clay Katherine Y
Bought by
Clay Katherine Y and Clay Revocable Liv Katherine Y
Current Estimated Value
Purchase Details
Closed on
May 12, 2015
Sold by
Adovnik Kelly G
Bought by
Clay Katherine Y
Purchase Details
Closed on
Jun 20, 2014
Sold by
Davis John M and Davis Alexandra S
Bought by
Adovnik Kelly G
Home Financials for this Owner
Home Financials are based on the most recent Mortgage that was taken out on this home.
Original Mortgage
$155,000
Interest Rate
4.07%
Mortgage Type
VA
Purchase Details
Closed on
Nov 11, 2005
Sold by
Johns Tny
Bought by
Davis John M and Davis Alexandra S
Home Financials for this Owner
Home Financials are based on the most recent Mortgage that was taken out on this home.
Original Mortgage
$132,000
Interest Rate
5.93%
Mortgage Type
New Conventional
Create a Home Valuation Report for This Property
The Home Valuation Report is an in-depth analysis detailing your home's value as well as a comparison with similar homes in the area
Home Values in the Area
Average Home Value in this Area
Purchase History
| Date | Buyer | Sale Price | Title Company |
|---|---|---|---|
| Clay Katherine Y | -- | None Available | |
| Clay Katherine Y | $160,000 | Amerititle | |
| Adovnik Kelly G | $155,000 | Amerititle | |
| Davis John M | $176,605 | Amerititle |
Source: Public Records
Mortgage History
| Date | Status | Borrower | Loan Amount |
|---|---|---|---|
| Previous Owner | Adovnik Kelly G | $155,000 | |
| Previous Owner | Davis John M | $132,000 |
Source: Public Records
Tax History Compared to Growth
Tax History
| Year | Tax Paid | Tax Assessment Tax Assessment Total Assessment is a certain percentage of the fair market value that is determined by local assessors to be the total taxable value of land and additions on the property. | Land | Improvement |
|---|---|---|---|---|
| 2024 | $2,280 | $166,930 | -- | -- |
| 2023 | $2,202 | $162,070 | $0 | $0 |
| 2022 | $2,519 | $157,350 | $0 | $0 |
| 2021 | $2,505 | $152,770 | $0 | $0 |
| 2020 | $2,436 | $148,322 | $0 | $0 |
| 2019 | $2,353 | $139,808 | $0 | $0 |
| 2018 | $2,291 | $139,808 | $0 | $0 |
| 2017 | $2,252 | $135,736 | $0 | $0 |
| 2016 | $2,154 | $127,945 | $0 | $0 |
| 2015 | $2,063 | $127,945 | $0 | $0 |
| 2013 | -- | $120,600 | $0 | $0 |
Source: Public Records
Map
Nearby Homes
- 591 NE Brookstone Dr
- 490 NE Brookstone Dr
- 1112 NE Cobblestone Ct
- 1196 NE Cobblestone Ct
- 1162 NE Cobblestone Ct
- 1242 NE Cobblestone Ct
- 735 NE Loper Ave
- 630 NE Fieldstone Ln
- 1575 NE Lisa Ct
- 310 NE Mariposa Ave
- 1071 NE Sunrise St
- 486 NE 13th St
- 1337 NE Barney St
- 1085 NE Henry Dr
- 1552 NE Alabama Way
- 1290 NE Carson St
- 795 NE Ochoco Ave
- 1156 NE Steins Pillar Dr
- 1144 NE Henry Dr
- 1214 NE Loper Ave
- 628 NE Robin Place Unit Lot26
- 628 NE Robin Place
- 584 NE Robin Place Unit Lot28
- 584 NE Robin Place
- 646 NE Robin Place Unit Lot25
- 646 NE Robin Place
- 566 NE Robin Place Unit Lot29
- 566 NE Robin Place
- 643 NE Brookstone Dr
- 625 NE Brookstone Dr
- 609 NE Robin Place Unit Lot 3
- 609 NE Robin Place
- 661 NE Brookstone Dr
- 625 NE Robin Place Unit Lot 4
- 625 NE Robin Place
- Lot 30-33 NE Brookstone Dr
- 597 NE Robin Place Unit Lot 2
- 597 NE Robin Place
- 664 NE Robin Place