Estimated Value: $454,488 - $540,000
4
Beds
2
Baths
2,306
Sq Ft
$219/Sq Ft
Est. Value
About This Home
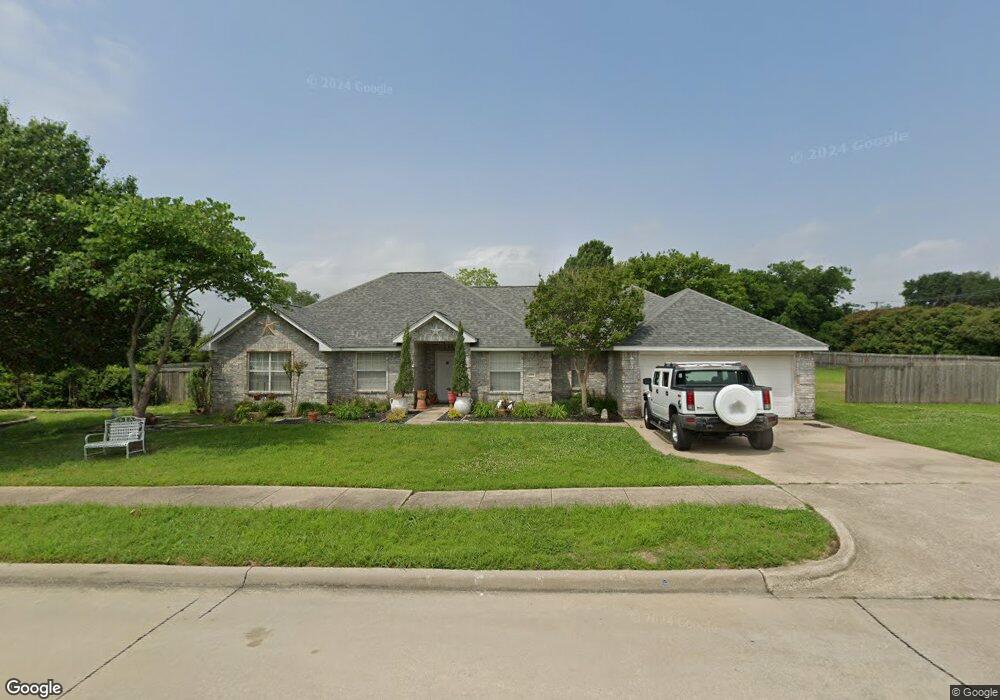
This home is located at 600 Oakbrook Dr, Wylie, TX 75098 and is currently estimated at $505,122, approximately $219 per square foot. 600 Oakbrook Dr is a home located in Collin County with nearby schools including R F Hartman Elementary School, AB Harrison Intermediate School, and Grady Burnett J High School.
Ownership History
Date
Name
Owned For
Owner Type
Purchase Details
Closed on
Dec 15, 2004
Sold by
Thorsen Tanya L and Fernando Pena J
Bought by
Rojas Garcia Jose D and Rojas Aurora C
Current Estimated Value
Home Financials for this Owner
Home Financials are based on the most recent Mortgage that was taken out on this home.
Original Mortgage
$167,400
Outstanding Balance
$103,459
Interest Rate
9.45%
Mortgage Type
Purchase Money Mortgage
Estimated Equity
$401,663
Purchase Details
Closed on
Sep 24, 1999
Sold by
Goff Homes Inc
Bought by
Thorsen Tanya L
Home Financials for this Owner
Home Financials are based on the most recent Mortgage that was taken out on this home.
Original Mortgage
$120,000
Interest Rate
8.02%
Purchase Details
Closed on
May 20, 1999
Sold by
Wylie Stoneridge Farms Lp
Bought by
Goff Homes Inc
Home Financials for this Owner
Home Financials are based on the most recent Mortgage that was taken out on this home.
Original Mortgage
$214,600
Interest Rate
6.89%
Create a Home Valuation Report for This Property
The Home Valuation Report is an in-depth analysis detailing your home's value as well as a comparison with similar homes in the area
Home Values in the Area
Average Home Value in this Area
Purchase History
| Date | Buyer | Sale Price | Title Company |
|---|---|---|---|
| Rojas Garcia Jose D | -- | -- | |
| Thorsen Tanya L | -- | -- | |
| Goff Homes Inc | -- | -- |
Source: Public Records
Mortgage History
| Date | Status | Borrower | Loan Amount |
|---|---|---|---|
| Open | Rojas Garcia Jose D | $167,400 | |
| Previous Owner | Thorsen Tanya L | $120,000 | |
| Previous Owner | Goff Homes Inc | $214,600 | |
| Closed | Rojas Garcia Jose D | $9,300 |
Source: Public Records
Tax History Compared to Growth
Tax History
| Year | Tax Paid | Tax Assessment Tax Assessment Total Assessment is a certain percentage of the fair market value that is determined by local assessors to be the total taxable value of land and additions on the property. | Land | Improvement |
|---|---|---|---|---|
| 2025 | $5,249 | $464,914 | $128,250 | $336,664 |
| 2024 | $5,249 | $443,284 | $128,250 | $367,233 |
| 2023 | $5,249 | $402,985 | $128,250 | $276,802 |
| 2022 | $9,873 | $450,020 | $128,250 | $321,770 |
| 2021 | $7,836 | $333,045 | $85,500 | $247,545 |
| 2020 | $7,639 | $307,650 | $66,500 | $241,150 |
| 2019 | $8,410 | $320,029 | $66,500 | $253,529 |
| 2018 | $8,347 | $309,950 | $66,500 | $243,450 |
| 2017 | $7,289 | $270,670 | $57,000 | $213,670 |
| 2016 | $6,620 | $238,260 | $57,000 | $181,260 |
| 2015 | $5,575 | $199,514 | $45,600 | $153,914 |
Source: Public Records
Map
Nearby Homes
- 414 Briarwood Dr
- 416 Dogwood Dr
- 811 Forest Edge Ln
- 327 S 4th St
- 306 Woodhollow Ct
- 825 Forest Edge Ln
- 300 Woodhollow Ct
- 820 Foxwood Ln
- 329 S 2nd St
- 416 S 1st St
- 825 Foxwood Ln
- 104 Rushcreek Dr
- 216 Cedar Ridge St
- 217 Cloudcroft Dr
- 301 S 3rd St
- 702 S Ballard Ave
- 1306 Angel Fire Dr
- 409 Cedar Ridge Dr
- 800 Twin Oaks Dr
- 314 Lake Texoma Dr
- 606 E Stone Rd
- 800 Crestview Ln
- 604 E Stone Rd
- 610 Oakbrook Dr
- 515 Woodhollow Dr
- 514 Woodhollow Dr
- 801 Crestview Ln
- 513 Woodhollow Dr
- 602 E Stone Rd
- 810 Crestview Ln
- 512 Woodhollow Dr
- 517 Dogwood Dr
- 511 Woodhollow Dr
- 507 Thomas St
- 515 Dogwood Dr
- 510 Woodhollow Dr
- 811 Crestview Ln
- 600 E Stone Rd
- 620 Oakbrook Dr
- 509 Woodhollow Dr