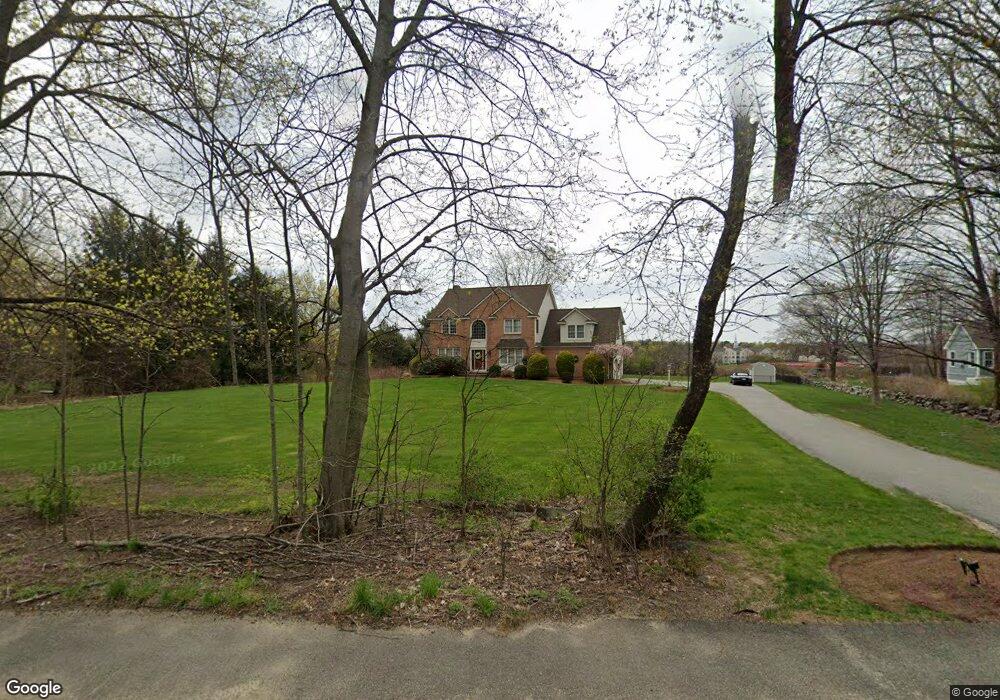
600 Osgood St North Andover, MA 01845
Estimated Value: $1,025,754 - $1,267,000
4
Beds
3
Baths
2,884
Sq Ft
$399/Sq Ft
Est. Value
About This Home
This home is located at 600 Osgood St, North Andover, MA 01845 and is currently estimated at $1,150,439, approximately $398 per square foot. 600 Osgood St is a home located in Essex County with nearby schools including Kittredge Elementary School, North Andover Middle School, and North Andover High School.
Ownership History
Date
Name
Owned For
Owner Type
Purchase Details
Closed on
Jun 24, 1994
Sold by
Rogers Park Rt
Bought by
Mollica Mark W
Current Estimated Value
Home Financials for this Owner
Home Financials are based on the most recent Mortgage that was taken out on this home.
Original Mortgage
$278,400
Interest Rate
8.74%
Mortgage Type
Purchase Money Mortgage
Create a Home Valuation Report for This Property
The Home Valuation Report is an in-depth analysis detailing your home's value as well as a comparison with similar homes in the area
Home Values in the Area
Average Home Value in this Area
Purchase History
| Date | Buyer | Sale Price | Title Company |
|---|---|---|---|
| Mollica Mark W | $348,000 | -- |
Source: Public Records
Mortgage History
| Date | Status | Borrower | Loan Amount |
|---|---|---|---|
| Open | Mollica Mark W | $258,000 | |
| Closed | Mollica Mark W | $278,400 |
Source: Public Records
Tax History Compared to Growth
Tax History
| Year | Tax Paid | Tax Assessment Tax Assessment Total Assessment is a certain percentage of the fair market value that is determined by local assessors to be the total taxable value of land and additions on the property. | Land | Improvement |
|---|---|---|---|---|
| 2025 | $11,258 | $999,800 | $419,700 | $580,100 |
| 2024 | $10,711 | $965,800 | $397,600 | $568,200 |
| 2023 | $10,175 | $831,300 | $335,800 | $495,500 |
| 2022 | $9,704 | $717,200 | $291,600 | $425,600 |
| 2021 | $9,331 | $658,500 | $265,100 | $393,400 |
| 2020 | $8,956 | $651,800 | $258,400 | $393,400 |
| 2019 | $8,741 | $651,800 | $258,400 | $393,400 |
| 2018 | $9,471 | $651,800 | $258,400 | $393,400 |
| 2017 | $9,845 | $689,400 | $231,100 | $458,300 |
| 2016 | $9,304 | $652,000 | $233,400 | $418,600 |
| 2015 | $9,221 | $640,800 | $218,700 | $422,100 |
Source: Public Records
Map
Nearby Homes
- 4 Stacy Dr Unit 4
- 12 Walker Rd Unit 6
- 5 Walker Rd Unit 3
- 64 E Water St
- 33 Upland St
- 15 Furber Ave
- 29 Brightwood Ave
- 84 Mill Pond Unit 84
- 84 Mill Pond
- 98 Mill Pond
- 88 Elm St Unit 1
- 16 Court St
- 385 Sutton St
- 112 Mill Pond
- 116 Mill Pond
- 148 Main St Unit O102
- 148 Main St Unit F444
- 148 Main St Unit S327
- 372-374 Main St
- 269 Sutton St
- 650 Osgood St
- 592 Osgood St
- 588 Osgood St
- 653 Osgood St
- 676 Osgood St
- 586 Osgood St
- 657 Osgood St
- 584 Osgood St
- 696 Osgood St
- 580 Osgood St
- 578 Osgood St
- 665 Osgood St
- 700 Osgood St
- 574 Osgood St
- 623 Osgood St
- 566 Osgood St
- 798 Chickering Rd
- 796 Chickering Rd
- 798 Chickering Rd Unit 1
- 798 Chickering Rd Unit 798