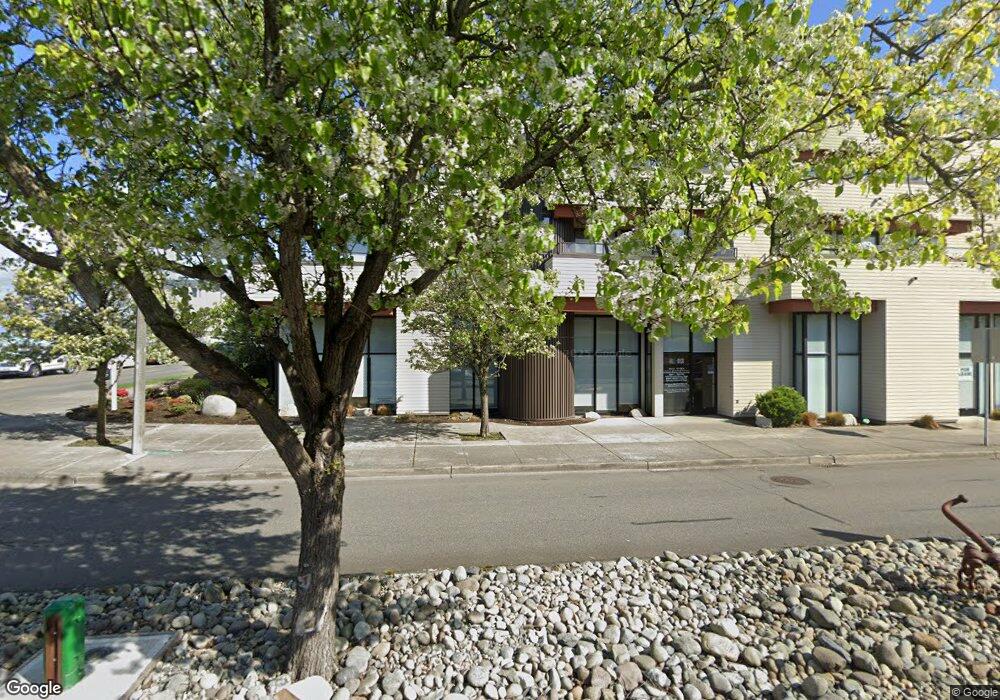
600 S 227th St Unit 104 Des Moines, WA 98198
Central Des Moines NeighborhoodEstimated Value: $564,000 - $699,000
2
Beds
2
Baths
1,205
Sq Ft
$531/Sq Ft
Est. Value
About This Home
This home is located at 600 S 227th St Unit 104, Des Moines, WA 98198 and is currently estimated at $639,728, approximately $530 per square foot. 600 S 227th St Unit 104 is a home located in King County with nearby schools including Des Moines Elementary School, Pacific Middle School, and Mount Rainier High School.
Ownership History
Date
Name
Owned For
Owner Type
Purchase Details
Closed on
Feb 18, 2020
Sold by
Sakaguchi Sono
Bought by
Martin Allison M and Martin Kevin D
Current Estimated Value
Home Financials for this Owner
Home Financials are based on the most recent Mortgage that was taken out on this home.
Original Mortgage
$220,000
Outstanding Balance
$173,530
Interest Rate
3.6%
Mortgage Type
New Conventional
Estimated Equity
$466,198
Purchase Details
Closed on
Sep 10, 2002
Sold by
Bartlett June L
Bought by
Sakaguchi Paul K and Sakaguchi Sono
Home Financials for this Owner
Home Financials are based on the most recent Mortgage that was taken out on this home.
Original Mortgage
$280,000
Interest Rate
5.5%
Mortgage Type
Commercial
Purchase Details
Closed on
Jul 26, 2001
Sold by
Marina View Properties Llc
Bought by
Bartlett June L
Home Financials for this Owner
Home Financials are based on the most recent Mortgage that was taken out on this home.
Original Mortgage
$268,450
Interest Rate
7.15%
Mortgage Type
Commercial
Create a Home Valuation Report for This Property
The Home Valuation Report is an in-depth analysis detailing your home's value as well as a comparison with similar homes in the area
Home Values in the Area
Average Home Value in this Area
Purchase History
| Date | Buyer | Sale Price | Title Company |
|---|---|---|---|
| Martin Allison M | $465,000 | Cw Title | |
| Sakaguchi Paul K | $350,000 | Chicago Title Insurance Co | |
| Bartlett June L | $357,990 | Chicago Title Insurance Co |
Source: Public Records
Mortgage History
| Date | Status | Borrower | Loan Amount |
|---|---|---|---|
| Open | Martin Allison M | $220,000 | |
| Previous Owner | Sakaguchi Paul K | $280,000 | |
| Previous Owner | Bartlett June L | $268,450 |
Source: Public Records
Tax History Compared to Growth
Tax History
| Year | Tax Paid | Tax Assessment Tax Assessment Total Assessment is a certain percentage of the fair market value that is determined by local assessors to be the total taxable value of land and additions on the property. | Land | Improvement |
|---|---|---|---|---|
| 2024 | $6,830 | $578,000 | $28,900 | $549,100 |
| 2023 | $6,612 | $711,000 | $28,900 | $682,100 |
| 2022 | $5,798 | $602,000 | $28,900 | $573,100 |
| 2021 | $6,216 | $462,000 | $28,900 | $433,100 |
| 2020 | $7,186 | $550,000 | $28,900 | $521,100 |
| 2018 | $5,875 | $454,000 | $24,500 | $429,500 |
| 2017 | $5,618 | $409,000 | $24,500 | $384,500 |
| 2016 | $5,826 | $395,000 | $24,500 | $370,500 |
| 2015 | $6,314 | $418,000 | $24,500 | $393,500 |
| 2014 | -- | $447,000 | $24,500 | $422,500 |
| 2013 | -- | $372,000 | $24,500 | $347,500 |
Source: Public Records
Map
Nearby Homes
- 22315 6th Ave S Unit A109
- 22226 6th Ave S Unit 201
- 22215 6th Ave S Unit 106
- 22222 Dock Ave S Unit 1C
- 22218 5th Ave S Unit 101
- 1020 S 230th St Unit 307B
- 1020 S 230th St Unit B108
- 506 S 222nd St Unit 1
- 21937 7th Ave S Unit B213
- 1251 S 230th St
- 23319 11th Place S
- 21833 7th Ave S
- 212 S 219th St
- 1508 S 223rd St
- 161 S 216th St
- 1619 S 226th Place
- 21845 15th Ave S
- 1215 S 237th Ln Unit 1308
- 23405 16th Place S Unit C104
- 23723 12th Place S Unit 1701
- 620 S 227th St Unit 301
- 620 S 227th St Unit 207
- 620 S 227th St Unit 305
- 620 S 227th St Unit 204
- 620 S 227th St Unit 104
- 620 S 227th St Unit 304
- 620 S 227th St Unit 103
- 620 S 227th St Unit 303
- 620 S 227th St Unit 201
- 620 S 227th St Unit 105
- 620 S 227th St Unit 101
- 620 S 227th St Unit 306
- 620 S 227th St
- 620 S 227th St Unit 102
- 620 S 227th St Unit 205
- 620 S 227th St Unit 203
- 600 S 227th St Unit 303
- 600 S 227th St Unit 101
- 600 S 227th St Unit 304
- 600 S 227th St Unit 202