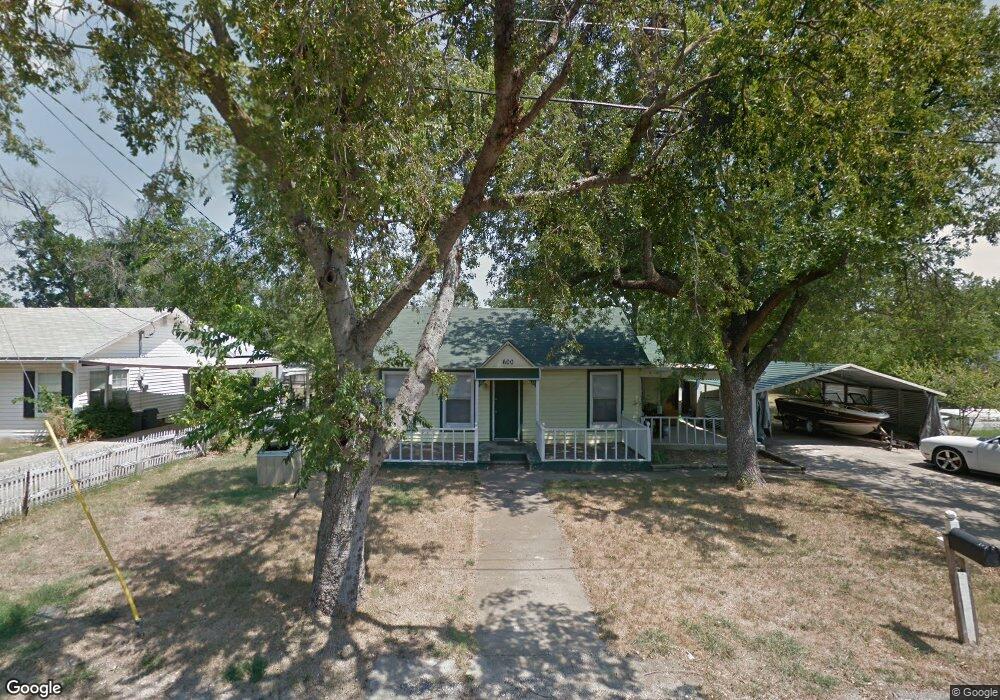
600 S 3rd St Sanger, TX 76266
Estimated Value: $203,423 - $258,000
2
Beds
1
Bath
990
Sq Ft
$240/Sq Ft
Est. Value
About This Home
This home is located at 600 S 3rd St, Sanger, TX 76266 and is currently estimated at $237,106, approximately $239 per square foot. 600 S 3rd St is a home located in Denton County with nearby schools including Butterfield Elementary School, Clear Creek Intermediate School, and Sanger Sixth Grade Campus.
Ownership History
Date
Name
Owned For
Owner Type
Purchase Details
Closed on
Oct 25, 2019
Sold by
B J H Johnson Properties Ltd
Bought by
Mount Sean and Mount Susan
Current Estimated Value
Home Financials for this Owner
Home Financials are based on the most recent Mortgage that was taken out on this home.
Original Mortgage
$161,912
Outstanding Balance
$141,843
Interest Rate
3.5%
Mortgage Type
FHA
Estimated Equity
$95,263
Purchase Details
Closed on
Apr 17, 2019
Sold by
Knight Family Partners Llc
Bought by
Westoplex Renewal Company Llc
Purchase Details
Closed on
Dec 30, 2010
Sold by
Karvouniaris John
Bought by
Greek Development Llc
Purchase Details
Closed on
Nov 7, 2007
Sold by
Cogdell Danny and Cogdell Sue
Bought by
Karvouniaris John
Purchase Details
Closed on
Sep 21, 2005
Sold by
Pfaffly Allan W and Pfaffly Carolyn A
Bought by
Cogdell Danny and Cogdell Sue
Create a Home Valuation Report for This Property
The Home Valuation Report is an in-depth analysis detailing your home's value as well as a comparison with similar homes in the area
Home Values in the Area
Average Home Value in this Area
Purchase History
| Date | Buyer | Sale Price | Title Company |
|---|---|---|---|
| Mount Sean | -- | Title Resources | |
| Westoplex Renewal Company Llc | -- | Alamo Title Company | |
| Greek Development Llc | -- | None Available | |
| Karvouniaris John | -- | Title Resources | |
| Cogdell Danny | -- | -- |
Source: Public Records
Mortgage History
| Date | Status | Borrower | Loan Amount |
|---|---|---|---|
| Open | Mount Sean | $161,912 |
Source: Public Records
Tax History Compared to Growth
Tax History
| Year | Tax Paid | Tax Assessment Tax Assessment Total Assessment is a certain percentage of the fair market value that is determined by local assessors to be the total taxable value of land and additions on the property. | Land | Improvement |
|---|---|---|---|---|
| 2025 | $2,825 | $216,498 | $84,395 | $142,907 |
| 2024 | $3,978 | $196,816 | $0 | $0 |
| 2023 | $2,469 | $178,924 | $65,641 | $113,283 |
| 2022 | $4,295 | $193,652 | $64,650 | $153,638 |
| 2021 | $3,700 | $188,724 | $52,895 | $135,829 |
| 2020 | $3,541 | $160,043 | $52,895 | $107,148 |
| 2019 | $1,821 | $80,000 | $52,895 | $27,105 |
| 2018 | $2,838 | $124,000 | $52,895 | $71,105 |
| 2017 | $1,725 | $75,000 | $52,895 | $22,105 |
| 2016 | $1,717 | $53,000 | $29,386 | $23,614 |
| 2015 | $1,226 | $53,000 | $29,386 | $23,614 |
| 2013 | -- | $55,706 | $29,386 | $26,320 |
Source: Public Records
Map
Nearby Homes
- 319 Austin St
- 505 Houston St
- 509 Marshall St
- 109 Colonial Heights
- 109 S 5th St
- 185 Aster Dr
- 710 W Willow St
- 113 Diane Dr
- 0000 Rector Rd
- 108 Magnolia Dr
- 212 Diane Dr
- 936 First St
- 124 Morning Glory
- 942 First St
- 226 Hillcrest St
- 182 Creekside Dr
- 1010 Bolivar St
- 175 Creekside Dr
- 114 Pintail Ln
- 705 Chaparral Rd