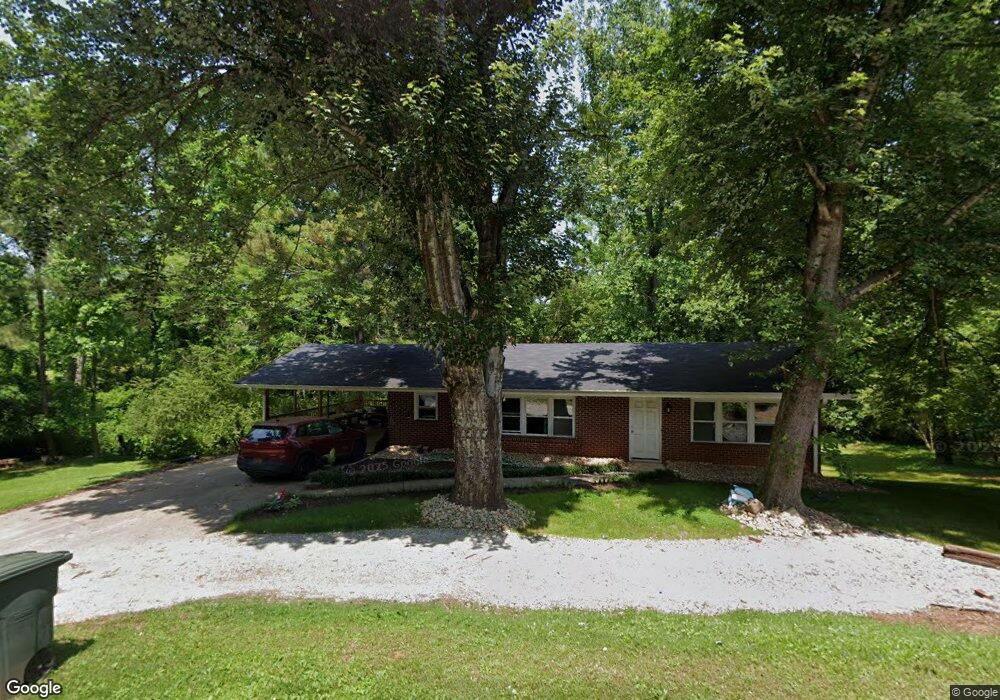
600 Sherwood Dr Unit BRING ALL REASONABLE Seneca, SC 29678
Estimated Value: $201,000 - $258,000
2
Beds
2
Baths
1,114
Sq Ft
$202/Sq Ft
Est. Value
About This Home
This home is located at 600 Sherwood Dr Unit BRING ALL REASONABLE, Seneca, SC 29678 and is currently estimated at $224,563, approximately $201 per square foot. 600 Sherwood Dr Unit BRING ALL REASONABLE is a home located in Oconee County with nearby schools including Blue Ridge Elementary School, Seneca Middle School, and Seneca High School.
Ownership History
Date
Name
Owned For
Owner Type
Purchase Details
Closed on
Jul 30, 2019
Sold by
Huebner Jeffrey and Huebner Angela
Bought by
Morphew Brittany R
Current Estimated Value
Home Financials for this Owner
Home Financials are based on the most recent Mortgage that was taken out on this home.
Original Mortgage
$124,699
Outstanding Balance
$110,416
Interest Rate
4.25%
Mortgage Type
FHA
Estimated Equity
$114,147
Purchase Details
Closed on
Mar 22, 2018
Sold by
Jpmorgan Chase Bank National Assocaiton
Bought by
Huebner Jeffrey and Huebner Angela
Purchase Details
Closed on
Nov 28, 2017
Sold by
Beardon Hilton J
Bought by
Jpmorgan Chase Bank
Purchase Details
Closed on
May 7, 2010
Sold by
Wallace Mason W and Wallace Lindsy J
Bought by
Bearden Hilton J and Bearden Cathy
Home Financials for this Owner
Home Financials are based on the most recent Mortgage that was taken out on this home.
Original Mortgage
$71,400
Interest Rate
5.15%
Mortgage Type
New Conventional
Create a Home Valuation Report for This Property
The Home Valuation Report is an in-depth analysis detailing your home's value as well as a comparison with similar homes in the area
Home Values in the Area
Average Home Value in this Area
Purchase History
| Date | Buyer | Sale Price | Title Company |
|---|---|---|---|
| Morphew Brittany R | $127,000 | None Available | |
| Huebner Jeffrey | $34,900 | None Available | |
| Jpmorgan Chase Bank | -- | None Available | |
| Bearden Hilton J | $70,000 | -- |
Source: Public Records
Mortgage History
| Date | Status | Borrower | Loan Amount |
|---|---|---|---|
| Open | Morphew Brittany R | $124,699 | |
| Previous Owner | Bearden Hilton J | $71,400 |
Source: Public Records
Tax History Compared to Growth
Tax History
| Year | Tax Paid | Tax Assessment Tax Assessment Total Assessment is a certain percentage of the fair market value that is determined by local assessors to be the total taxable value of land and additions on the property. | Land | Improvement |
|---|---|---|---|---|
| 2024 | $900 | $5,238 | $540 | $4,698 |
| 2023 | $870 | $5,238 | $540 | $4,698 |
| 2022 | $870 | $5,238 | $540 | $4,698 |
| 2021 | $553 | $4,980 | $540 | $4,440 |
| 2020 | $886 | $4,980 | $540 | $4,440 |
| 2019 | $886 | $0 | $0 | $0 |
| 2018 | $1,139 | $0 | $0 | $0 |
| 2017 | $553 | $0 | $0 | $0 |
| 2016 | $553 | $0 | $0 | $0 |
| 2015 | -- | $0 | $0 | $0 |
| 2014 | -- | $3,430 | $501 | $2,929 |
| 2013 | -- | $0 | $0 | $0 |
Source: Public Records
Map
Nearby Homes
- 510 Sherwood Dr
- 406 Woodland Dr
- 416 Sherwood Dr
- 101 Pleasant Dr
- 611 E South 6th St
- 536 E South 5th St
- 103 Linda Dr
- 502 Keith Ln
- 21 Lonsdale St
- 405 S Cherry St
- 311 Tribble St
- 405 Keith Ln
- 1044 Fairfield Dr
- 410 S Cherry St
- 307 Hunter St
- 9 Humbert St
- 303 Meadow Dr
- 303 Hunter St
- 405 E South 4th St
- 116 Elliott Dr
- 600 Sherwood Dr
- 101 Shadow Ln
- 506 Sherwood Dr
- 606 Robinhood Dr
- 201 Shadow Ln
- 503 Sherwood Dr
- 419 E Crescent Dr
- 502 Sherwood Dr
- 602 Robinhood Dr
- 205 Shadow Ln
- 213 Evergreen Cir
- 603 Robinhood Dr
- 210 Evergreen Cir
- 1170 Scarlett St
- 701 Sherwood Dr
- 1007 Scarlett St
- 418 E Crescent Dr
- 211 Evergreen Cir
- 413 E Crescent Dr
- 424 Sherwood Dr Unit JUST REDUCED !!