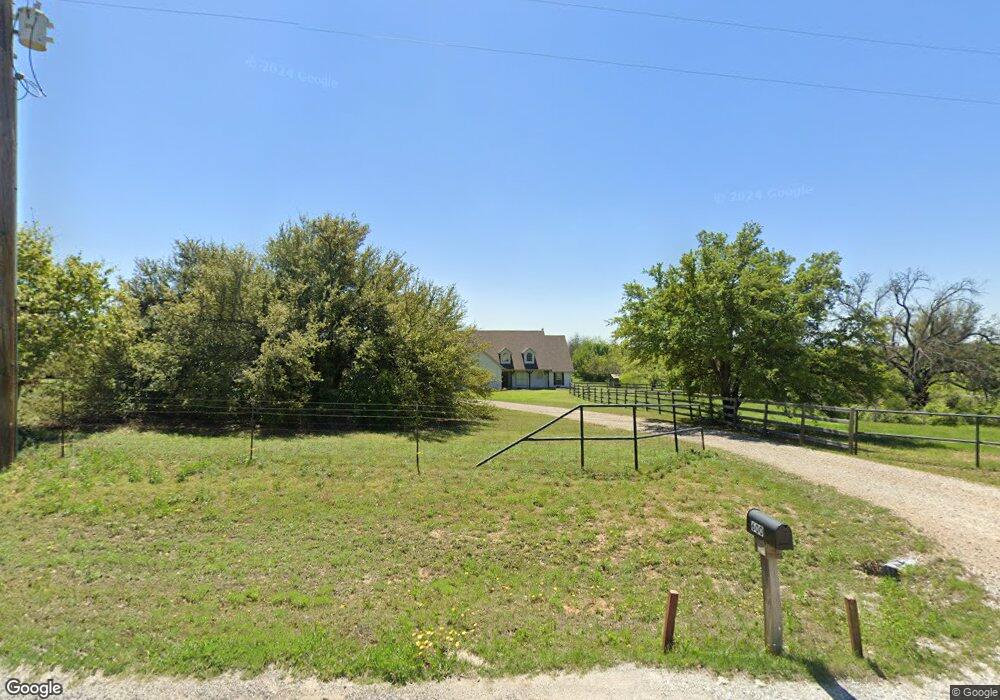
600 Sosebee Bend Rd Weatherford, TX 76088
Estimated Value: $448,779 - $488,000
4
Beds
2
Baths
2,015
Sq Ft
$232/Sq Ft
Est. Value
About This Home
This home is located at 600 Sosebee Bend Rd, Weatherford, TX 76088 and is currently estimated at $468,390, approximately $232 per square foot. 600 Sosebee Bend Rd is a home located in Parker County with nearby schools including Wright Elementary School, Hall Middle School, and Weatherford High School.
Ownership History
Date
Name
Owned For
Owner Type
Purchase Details
Closed on
Mar 1, 2013
Sold by
Crowley Johnny Paul and Crowley Misty P
Bought by
Bland Jinger
Current Estimated Value
Home Financials for this Owner
Home Financials are based on the most recent Mortgage that was taken out on this home.
Original Mortgage
$207,653
Outstanding Balance
$145,803
Interest Rate
3.43%
Mortgage Type
New Conventional
Estimated Equity
$322,587
Purchase Details
Closed on
Jul 7, 2004
Sold by
Bullock David G and Bullock Cheryl L
Bought by
Bland Jinger
Purchase Details
Closed on
Jul 31, 2000
Sold by
Davis Donald
Bought by
Bland Jinger
Purchase Details
Closed on
Jun 27, 2000
Sold by
Davis Donald
Bought by
Bland Jinger
Purchase Details
Closed on
Feb 15, 1997
Bought by
Bland Jinger
Purchase Details
Closed on
Jan 1, 1901
Bought by
Bland Jinger
Create a Home Valuation Report for This Property
The Home Valuation Report is an in-depth analysis detailing your home's value as well as a comparison with similar homes in the area
Home Values in the Area
Average Home Value in this Area
Purchase History
| Date | Buyer | Sale Price | Title Company |
|---|---|---|---|
| Bland Jinger | -- | Providence Title | |
| Bland Jinger | -- | -- | |
| Bland Jinger | -- | -- | |
| Bland Jinger | -- | -- | |
| Bland Jinger | -- | -- | |
| Bland Jinger | -- | -- |
Source: Public Records
Mortgage History
| Date | Status | Borrower | Loan Amount |
|---|---|---|---|
| Open | Bland Jinger | $207,653 |
Source: Public Records
Tax History Compared to Growth
Tax History
| Year | Tax Paid | Tax Assessment Tax Assessment Total Assessment is a certain percentage of the fair market value that is determined by local assessors to be the total taxable value of land and additions on the property. | Land | Improvement |
|---|---|---|---|---|
| 2025 | $4,824 | $369,190 | $38,570 | $330,620 |
| 2024 | $4,824 | $359,930 | $38,020 | $321,910 |
| 2023 | $4,824 | $348,020 | $0 | $0 |
| 2022 | $5,891 | $316,390 | $23,780 | $292,610 |
| 2021 | $6,155 | $316,390 | $23,780 | $292,610 |
| 2020 | $5,623 | $278,210 | $20,960 | $257,250 |
| 2019 | $5,453 | $278,210 | $20,960 | $257,250 |
| 2018 | $4,983 | $229,110 | $12,710 | $216,400 |
| 2017 | $5,085 | $229,110 | $12,710 | $216,400 |
| 2016 | $4,635 | $208,870 | $12,710 | $196,160 |
| 2015 | $3,530 | $195,910 | $12,710 | $183,200 |
| 2014 | $3,068 | $161,850 | $12,710 | $149,140 |
Source: Public Records
Map
Nearby Homes
- 1930 Old Mineral Wells Hwy
- 1882 Old Mineral Wells Hwy
- 1008 Salvation Dr
- 2435 Old Mineral Wells Hwy
- 1520 Vine St
- 1442 W Water St
- 109 Garner Rd
- 1401 W Ball St
- 1402 W Water St
- 167 Duke Trail
- 1318 W Water St
- 1802 Greenwood Rd
- 115 Harmon St
- 1102 Chilton St
- TBD Hwy 920 Hwy
- 217 Clinton Dr
- 302 Case St
- Tract 1 Carter Dr
- 506 Chilton St
- 109 Rio Bravo Ct
- 612 Sosebee Bend Rd
- 000 Sosebee Bend Rd
- 0 Sosebee Bend Rd Unit 13330168
- 000 Sosebee Bend Rd Unit Tr. 2
- Tbd Sosebee Bend Rd
- 609 Sosebee Bend Rd
- 501 Sosebee Bend Rd
- 8 Westend Ln
- 3 Westend Ln
- 605 Sosebee Bend Rd
- 00 Sosebee Bend Rd Unit Tr. 1
- 513 Sosebee Bend Rd
- 511 Sosebee Bend Rd
- 1211 Garner Rd
- 415 Sosebee Bend Rd
- 1221 Old Garner Rd
- 400 Sosebee Bend Rd
- 1201 Old Garner Rd
- 1383 Old Garner Rd
- 503 Sosebee Bend Rd