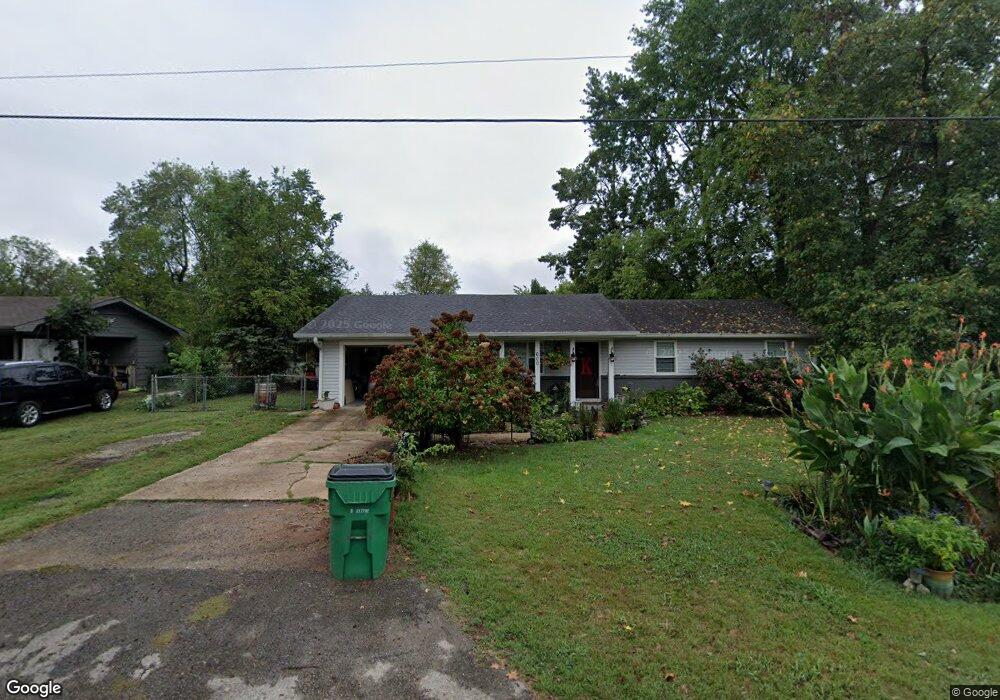
600 South St Flippin, AR 72634
Estimated Value: $155,665 - $170,000
--
Bed
2
Baths
1,344
Sq Ft
$119/Sq Ft
Est. Value
About This Home
This home is located at 600 South St, Flippin, AR 72634 and is currently estimated at $160,166, approximately $119 per square foot. 600 South St is a home located in Marion County with nearby schools including Flippin Elementary School, Flippin Middle School, and Flippin High School.
Ownership History
Date
Name
Owned For
Owner Type
Purchase Details
Closed on
Feb 13, 2007
Sold by
Aikman Nadyne W
Bought by
Keys Ambre G
Current Estimated Value
Home Financials for this Owner
Home Financials are based on the most recent Mortgage that was taken out on this home.
Original Mortgage
$73,000
Outstanding Balance
$43,845
Interest Rate
6.21%
Estimated Equity
$116,321
Purchase Details
Closed on
Feb 9, 2007
Sold by
Wood Cs
Bought by
Keys Ambre G
Home Financials for this Owner
Home Financials are based on the most recent Mortgage that was taken out on this home.
Original Mortgage
$73,000
Outstanding Balance
$43,845
Interest Rate
6.21%
Estimated Equity
$116,321
Purchase Details
Closed on
May 28, 2004
Bought by
Aikman Trust
Purchase Details
Closed on
Oct 26, 1999
Bought by
Aikman and Aikman Wood
Purchase Details
Closed on
Jul 9, 1987
Bought by
Wd
Create a Home Valuation Report for This Property
The Home Valuation Report is an in-depth analysis detailing your home's value as well as a comparison with similar homes in the area
Home Values in the Area
Average Home Value in this Area
Purchase History
| Date | Buyer | Sale Price | Title Company |
|---|---|---|---|
| Keys Ambre G | -- | -- | |
| Keys Ambre G | -- | -- | |
| Aikman Trust | -- | -- | |
| Aikman | -- | -- | |
| Wd | -- | -- |
Source: Public Records
Mortgage History
| Date | Status | Borrower | Loan Amount |
|---|---|---|---|
| Open | Keys Ambre G | $73,000 | |
| Closed | Keys Ambre G | $73,000 |
Source: Public Records
Tax History Compared to Growth
Tax History
| Year | Tax Paid | Tax Assessment Tax Assessment Total Assessment is a certain percentage of the fair market value that is determined by local assessors to be the total taxable value of land and additions on the property. | Land | Improvement |
|---|---|---|---|---|
| 2024 | $1,059 | $22,300 | $2,000 | $20,300 |
| 2023 | $634 | $22,300 | $2,000 | $20,300 |
| 2022 | $684 | $22,300 | $2,000 | $20,300 |
| 2021 | $651 | $22,300 | $2,000 | $20,300 |
| 2020 | $564 | $19,770 | $2,000 | $17,770 |
| 2019 | $582 | $19,770 | $2,000 | $17,770 |
| 2018 | $607 | $19,770 | $2,000 | $17,770 |
| 2017 | $607 | $19,770 | $2,000 | $17,770 |
| 2016 | $571 | $19,390 | $2,000 | $17,390 |
| 2015 | $527 | $18,470 | $1,000 | $17,470 |
| 2014 | -- | $18,470 | $1,000 | $17,470 |
| 2013 | -- | $18,470 | $1,000 | $17,470 |
| 2012 | -- | $18,470 | $1,000 | $17,470 |
Source: Public Records
Map
Nearby Homes
- 604 Park St
- 503 Girard St
- 305 Walnut St
- 304 South St
- 615 Hillcrest St
- 770 05121 000 Hwy 62 412 E
- 00 8th St
- 770-05063-000 8th St
- 0 Hwy 62 B
- 770-05153-000 E Main St
- 121 E Industrial Park
- 121 E Industrial Park
- 105 & 107 S 2nd St
- 121 W Industrial Park Rd
- 84 Lydia Ln
- 1 Hwy 62b
- 0 Lydia Ln
- 527-00000-000 Lydia Ln
- 770-05769-000 E Hwy 62
- 6577 Arkansas 202