Olympus Condominiums 600 Three Islands Bl Unit 920 Hallandale Beach, FL 33009
Three Islands NeighborhoodEstimated Value: $227,000 - $366,000
1
Bed
2
Baths
1,000
Sq Ft
$282/Sq Ft
Est. Value
About This Home
This home is located at 600 Three Islands Bl Unit 920, Hallandale Beach, FL 33009 and is currently estimated at $281,522, approximately $281 per square foot. 600 Three Islands Bl Unit 920 is a home located in Broward County with nearby schools including Gulfstream Academy of Hallandale Beach, Hallandale High School, and Hollywood Academy of Arts & Science Middle School.
Ownership History
Date
Name
Owned For
Owner Type
Purchase Details
Closed on
Feb 22, 2017
Sold by
Rothesrtin Rachel and Lewis Michael A
Bought by
Natarov Roman
Current Estimated Value
Purchase Details
Closed on
Nov 26, 2007
Sold by
Lewis Michael and Rothstein Rachel
Bought by
Rothstein Rachel and Lewis Michael A
Purchase Details
Closed on
Sep 5, 2000
Sold by
Velasco Ary C and Velasco Gladys
Bought by
Lewis Michael and Rothstein Rachel
Purchase Details
Closed on
Oct 15, 1994
Sold by
Rudin Sue
Bought by
Velasco Ary C and Velasco Gladys
Home Financials for this Owner
Home Financials are based on the most recent Mortgage that was taken out on this home.
Original Mortgage
$42,800
Interest Rate
8.92%
Purchase Details
Closed on
May 21, 1993
Sold by
Rudin Sue
Bought by
Rudin Steven and Cohen Wendy
Create a Home Valuation Report for This Property
The Home Valuation Report is an in-depth analysis detailing your home's value as well as a comparison with similar homes in the area
Home Values in the Area
Average Home Value in this Area
Purchase History
| Date | Buyer | Sale Price | Title Company |
|---|---|---|---|
| Natarov Roman | $201,000 | Attorney | |
| Rothstein Rachel | -- | Attorney | |
| Lewis Michael | $68,000 | -- | |
| Velasco Ary C | $53,500 | -- | |
| Rudin Steven | -- | -- |
Source: Public Records
Mortgage History
| Date | Status | Borrower | Loan Amount |
|---|---|---|---|
| Previous Owner | Velasco Ary C | $42,800 |
Source: Public Records
Tax History Compared to Growth
Tax History
| Year | Tax Paid | Tax Assessment Tax Assessment Total Assessment is a certain percentage of the fair market value that is determined by local assessors to be the total taxable value of land and additions on the property. | Land | Improvement |
|---|---|---|---|---|
| 2025 | $2,701 | $236,210 | $23,620 | $212,590 |
| 2024 | $2,610 | $151,640 | -- | -- |
| 2023 | $2,610 | $147,230 | $0 | $0 |
| 2022 | $2,465 | $142,950 | $0 | $0 |
| 2021 | $2,309 | $138,790 | $13,880 | $124,910 |
| 2020 | $3,350 | $144,890 | $14,490 | $130,400 |
| 2019 | $3,285 | $141,040 | $14,100 | $126,940 |
| 2018 | $3,822 | $174,870 | $17,490 | $157,380 |
| 2017 | $3,123 | $146,170 | $0 | $0 |
| 2016 | $3,013 | $132,890 | $0 | $0 |
| 2015 | $2,725 | $120,810 | $0 | $0 |
| 2014 | $2,504 | $109,830 | $0 | $0 |
| 2013 | -- | $100,470 | $10,050 | $90,420 |
Source: Public Records
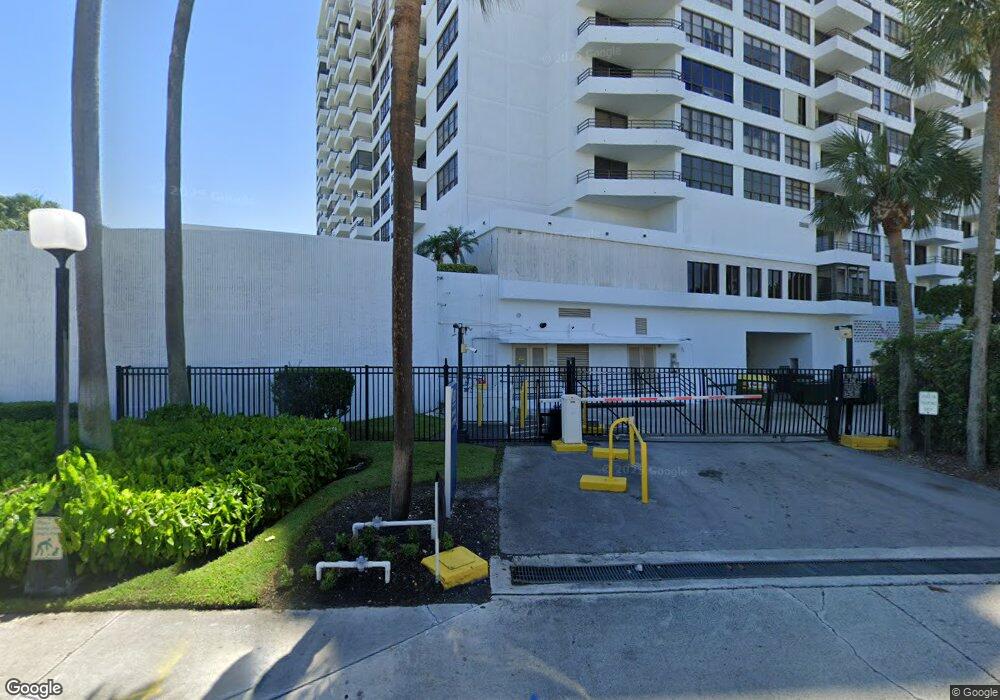
About Olympus Condominiums
Map
Nearby Homes
- 600 Three Islands Blvd Unit 1021
- 600 Three Islands Blvd Unit 1101
- 600 Three Islands Blvd Unit 418
- 600 Three Islands Blvd Unit 808B
- 600 Three Islands Blvd Unit 607
- 600 Three Islands Blvd Unit 1707
- 600 Three Islands Blvd Unit 301
- 600 Three Islands Blvd Unit 310B
- 600 Three Islands Blvd Unit 212
- 600 Three Islands Blvd Unit 1015
- 600 Three Islands Blvd Unit 1418
- 600 Three Islands Blvd Unit 1016
- 600 Three Islands Blvd Unit 615B
- 600 Three Islands Blvd Unit 620
- 600 Three Islands Blvd Unit 905B
- 600 Three Islands Blvd Unit 1703
- 600 Three Islands Blvd Unit 1522
- 600 Three Islands Blvd Unit 1207
- 600 Three Islands Blvd Unit 803
- 600 Three Islands Blvd Unit 504
- 600 Three Islands Bl Unit 1015
- 600 Three Islands Bl Unit 1715
- 600 Three Islands Bl Unit 711
- 600 Three Islands Bl Unit 820
- 600 Three Islands Bl Unit 1506
- 600 Three Islands Bl Unit 514
- 600 Three Islands Bl Unit 1718
- 600 Three Islands Bl Unit 1502
- 600 Three Islands Bl Unit 606B
- 600 Three Islands Bl Unit 1113
- 600 Three Islands Bl Unit 816
- 600 Three Islands Bl Unit 1719
- 600 Three Islands Bl Unit 218
- 600 Three Islands Bl Unit 1821
- 600 Three Islands Bl Unit 1414
- 600 Three Islands Bl Unit 402
- 600 Three Islands Bl Unit 1518
- 600 Three Islands Bl Unit 419
- 600 Three Islands Bl Unit 207
- 600 Three Islands Bl Unit 401