Estimated Value: $199,000 - $224,000
Studio
--
Bath
1,656
Sq Ft
$127/Sq Ft
Est. Value
About This Home
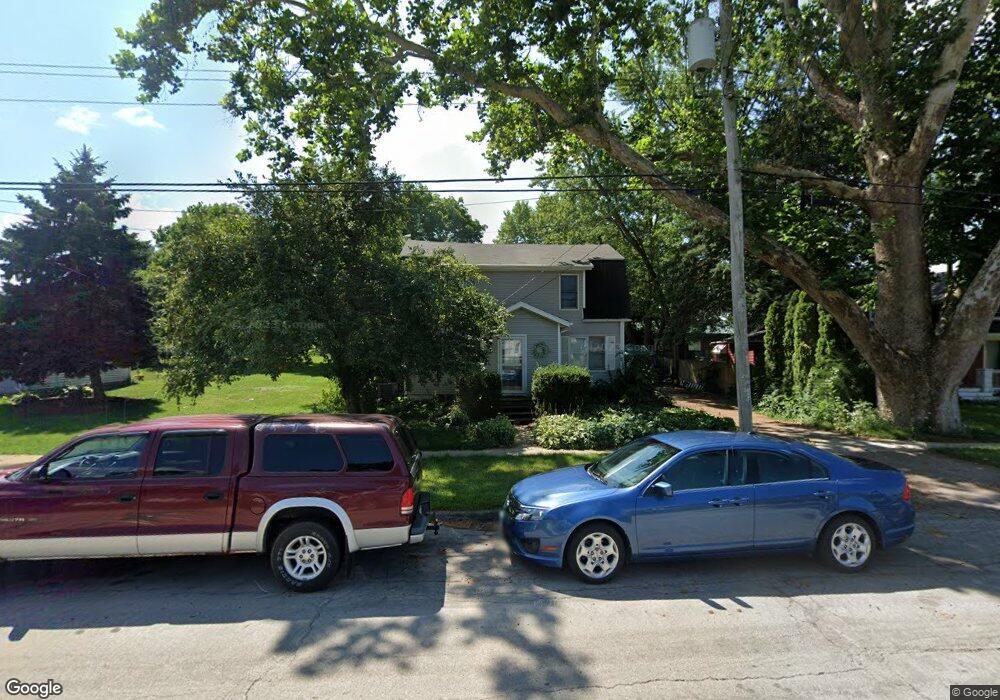
This home is located at 600 W 2nd St, Byron, IL 61010 and is currently estimated at $209,737, approximately $126 per square foot. 600 W 2nd St is a home located in Ogle County with nearby schools including Mary Morgan Elementary School, Byron Middle School, and Byron High School.
Ownership History
Date
Name
Owned For
Owner Type
Purchase Details
Closed on
Apr 22, 2021
Sold by
Fulrath Mittzi M
Bought by
Fulrath Aaron L and Williams Kathrine
Current Estimated Value
Purchase Details
Closed on
Oct 28, 2005
Sold by
Mccallen Daniel and Mccallen Stacie E
Bought by
Fulrath Aaron L and Fulrath Mittzi M
Home Financials for this Owner
Home Financials are based on the most recent Mortgage that was taken out on this home.
Original Mortgage
$134,105
Outstanding Balance
$69,245
Interest Rate
5.89%
Mortgage Type
FHA
Estimated Equity
$140,492
Purchase Details
Closed on
Jun 30, 2005
Sold by
Flohr Louis E and Flohr Marlene E
Bought by
Mccallen Stacie E and Perks Stacie E
Create a Home Valuation Report for This Property
The Home Valuation Report is an in-depth analysis detailing your home's value as well as a comparison with similar homes in the area
Home Values in the Area
Average Home Value in this Area
Purchase History
We collect this data history from publicly available records. To have your information removed, we recommend requesting removal directly through your county’s website.
| Date | Buyer | Sale Price | Title Company |
|---|---|---|---|
| Fulrath Aaron L | -- | None Available | |
| Fulrath Aaron L | $136,000 | None Available | |
| Mccallen Stacie E | $56,000 | None Available |
Source: Public Records
Mortgage History
We collect this data history from publicly available records. To have your information removed, we recommend requesting removal directly through your county’s website.
| Date | Status | Borrower | Loan Amount |
|---|---|---|---|
| Open | Fulrath Aaron L | $134,105 |
Source: Public Records
Tax History
| Year | Tax Paid | Tax Assessment Tax Assessment Total Assessment is a certain percentage of the fair market value that is determined by local assessors to be the total taxable value of land and additions on the property. | Land | Improvement |
|---|---|---|---|---|
| 2025 | $4,297 | $62,141 | $12,205 | $49,936 |
| 2024 | $4,297 | $56,246 | $11,047 | $45,199 |
| 2023 | $4,002 | $53,471 | $10,502 | $42,969 |
| 2022 | $3,738 | $49,588 | $9,739 | $39,849 |
| 2021 | $3,663 | $47,471 | $9,323 | $38,148 |
| 2020 | $3,368 | $46,540 | $9,140 | $37,400 |
| 2019 | $3,364 | $45,075 | $8,852 | $36,223 |
| 2018 | $3,351 | $43,911 | $8,623 | $35,288 |
| 2017 | $3,316 | $43,911 | $8,623 | $35,288 |
| 2016 | $3,109 | $43,105 | $8,465 | $34,640 |
| 2015 | $2,945 | $41,728 | $8,195 | $33,533 |
| 2014 | $2,914 | $41,728 | $8,195 | $33,533 |
| 2013 | $3,019 | $42,264 | $8,300 | $33,964 |
Source: Public Records
Map
Nearby Homes
- 808 Crest View Trail
- 407 W 4th St
- 8890 Hales Corner Rd Rd
- 509 N Walnut St
- 151 N Fox Run Ln
- 713 Birch St
- 4973 E Lawnside Dr
- 00 E Ashelford Dr Unit LOT 8
- 00 E Ashelford Dr
- 1257 Glacier Dr
- 849 7 Hickory Rd
- 1574 Warrenton Dr
- 5206 E Hubbard Trail
- 000 Route 72
- 6315 N River Rd
- 6468 N Deer Path Rd
- 6957 E Wildwood Rd
- 00 White Tail Trail
- 542 Heritage Dr
- 0 Illinois 72
Your Personal Tour Guide
Ask me questions while you tour the home.