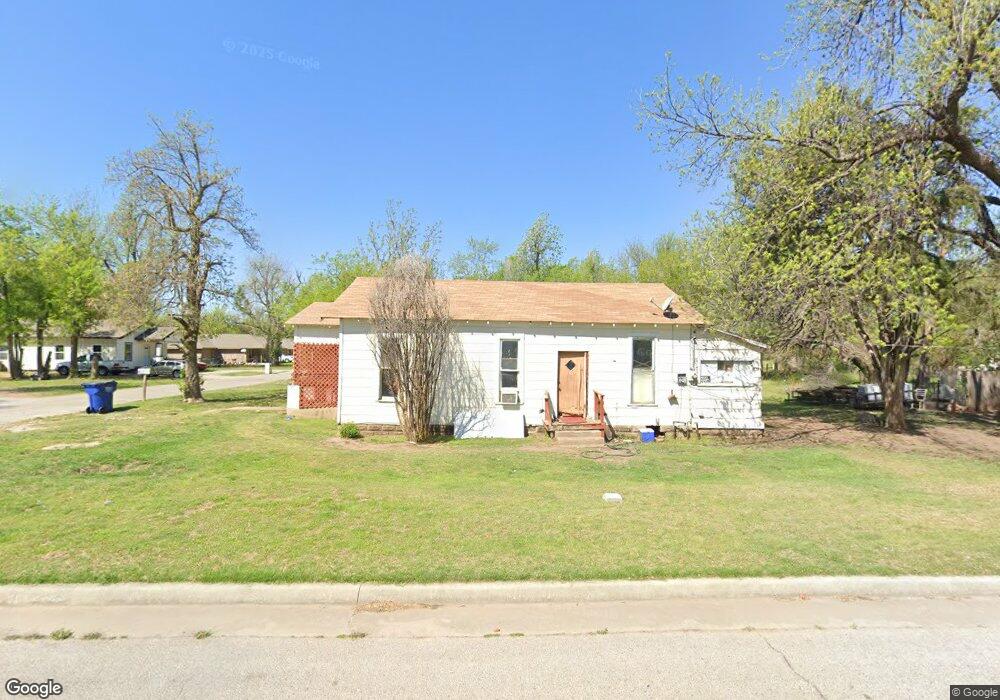
600 W Penn St El Reno, OK 73036
Estimated Value: $59,000 - $130,000
2
Beds
1
Bath
800
Sq Ft
$114/Sq Ft
Est. Value
About This Home
This home is located at 600 W Penn St, El Reno, OK 73036 and is currently estimated at $91,160, approximately $113 per square foot. 600 W Penn St is a home located in Canadian County with nearby schools including Hillcrest Elementary School, Rose Witcher Elementary School, and Lincoln Learning Center.
Ownership History
Date
Name
Owned For
Owner Type
Purchase Details
Closed on
May 8, 2019
Sold by
Kew Real Estate Llc
Bought by
Wright Shanieka R
Current Estimated Value
Purchase Details
Closed on
Jun 10, 2018
Sold by
Richey George E
Bought by
Kew Real Estate Llc
Purchase Details
Closed on
Mar 4, 2014
Sold by
Richey George
Bought by
Wright Shanieka R
Home Financials for this Owner
Home Financials are based on the most recent Mortgage that was taken out on this home.
Original Mortgage
$23,000
Interest Rate
4.36%
Mortgage Type
Seller Take Back
Purchase Details
Closed on
Feb 17, 2004
Sold by
Rolle Robert and Rolle Cliffornia
Purchase Details
Closed on
Feb 7, 2003
Sold by
Williams Frank A
Purchase Details
Closed on
Dec 28, 1994
Sold by
Clark Cavannah M
Purchase Details
Closed on
May 24, 1962
Sold by
Mewborn Mewborn R and Mewborn Sybil
Create a Home Valuation Report for This Property
The Home Valuation Report is an in-depth analysis detailing your home's value as well as a comparison with similar homes in the area
Home Values in the Area
Average Home Value in this Area
Purchase History
| Date | Buyer | Sale Price | Title Company |
|---|---|---|---|
| Wright Shanieka R | $25,000 | None Available | |
| Kew Real Estate Llc | -- | None Available | |
| Wright Shanieka R | $25,000 | None Available | |
| -- | $1,500 | -- | |
| -- | $8,500 | -- | |
| -- | $10,000 | -- | |
| -- | -- | -- |
Source: Public Records
Mortgage History
| Date | Status | Borrower | Loan Amount |
|---|---|---|---|
| Previous Owner | Wright Shanieka R | $23,000 |
Source: Public Records
Tax History Compared to Growth
Tax History
| Year | Tax Paid | Tax Assessment Tax Assessment Total Assessment is a certain percentage of the fair market value that is determined by local assessors to be the total taxable value of land and additions on the property. | Land | Improvement |
|---|---|---|---|---|
| 2024 | $395 | $3,870 | $276 | $3,594 |
| 2023 | $395 | $3,686 | $240 | $3,446 |
| 2022 | $378 | $3,510 | $240 | $3,270 |
| 2021 | $387 | $3,510 | $240 | $3,270 |
| 2020 | $382 | $3,510 | $240 | $3,270 |
| 2019 | $424 | $3,734 | $240 | $3,494 |
| 2018 | $386 | $3,428 | $240 | $3,188 |
| 2017 | $375 | $3,265 | $240 | $3,025 |
| 2016 | $359 | $3,265 | $240 | $3,025 |
| 2015 | $36 | $2,961 | $240 | $2,721 |
| 2014 | $36 | $315 | $240 | $75 |
Source: Public Records
Map
Nearby Homes
- 320 N Miles Ave
- 418 W Penn St
- 602 N Grand Ave
- 605 W Cheyenne St
- 111 N Admire Ave
- 400 N Choctaw Ave
- 710 Sunset Dr
- 211 S Ellison Ave
- 413 N Rock Island Ave
- 407 W Wade St
- 1108 W Hayes St
- 421 N Barker Ave
- 420 N Barker Ave
- 116 N Mahan Ave
- 0 Foreman Rd
- 506 S Evans Ave
- 120 N Macomb Ave
- 520 S Hadden Ave
- 1117 W London St
- 312 E Wade St
- 510 W Penn St
- 508 W Penn St
- 610 W Penn St
- 601 W Penn St
- 611 W Penn St
- 618 W Penn St
- 504 W Penn St
- 603 W Foreman St
- 312 N Miles Ave
- 609 W Foreman St
- 607 W Foreman St
- 505 W Foreman St
- 401 N Grand Ave
- 802 N Miles Ave
- 617 W Penn St
- 619 W Penn St
- 501 W Penn St
- 311 N Grand Ave
- 621 W Foreman St
- 600 W Rogers St