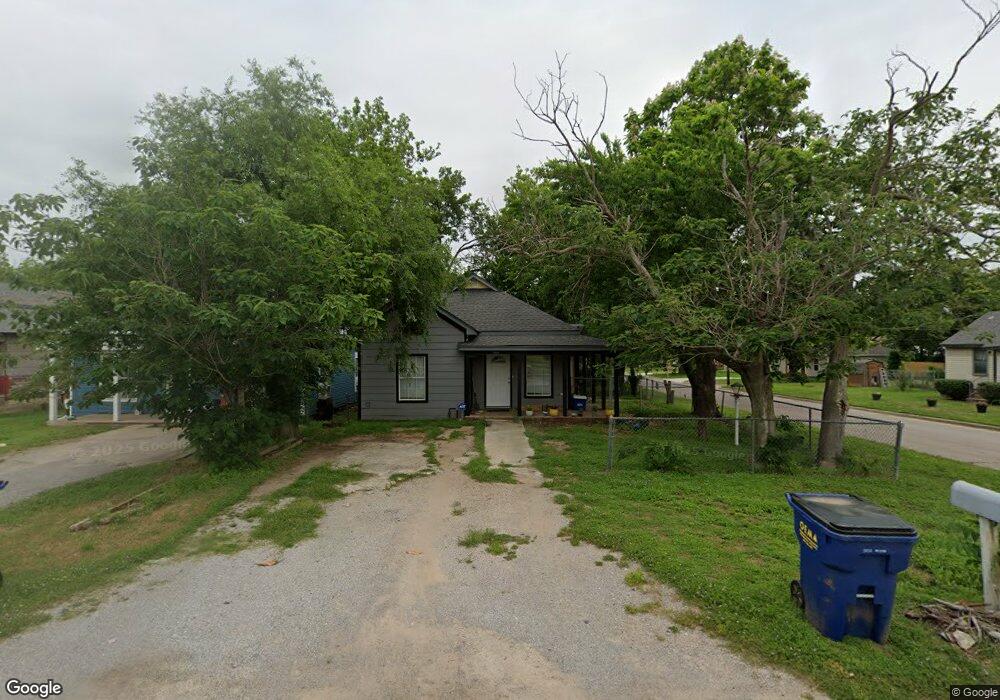
600 W Rogers St El Reno, OK 73036
Estimated Value: $87,000 - $137,000
3
Beds
1
Bath
1,042
Sq Ft
$108/Sq Ft
Est. Value
About This Home
This home is located at 600 W Rogers St, El Reno, OK 73036 and is currently estimated at $112,144, approximately $107 per square foot. 600 W Rogers St is a home located in Canadian County with nearby schools including Hillcrest Elementary School, Rose Witcher Elementary School, and Lincoln Learning Center.
Ownership History
Date
Name
Owned For
Owner Type
Purchase Details
Closed on
Dec 5, 2023
Sold by
Russell Kenny
Bought by
Huntleigh Co Holdings Llc-Series Da
Current Estimated Value
Home Financials for this Owner
Home Financials are based on the most recent Mortgage that was taken out on this home.
Original Mortgage
$76,532
Interest Rate
7.79%
Mortgage Type
Construction
Purchase Details
Closed on
Mar 13, 2018
Sold by
Trotter Estavion D and Trotter Janice M
Bought by
Today S Bank
Purchase Details
Closed on
Aug 3, 2007
Sold by
Thompson Carl A and Thompson Derrick
Bought by
Trotter Estavion
Purchase Details
Closed on
Oct 9, 1996
Sold by
Thompson Victor C
Purchase Details
Closed on
Dec 20, 1993
Sold by
Thompson Charlie and Thompson Bernice
Purchase Details
Closed on
Dec 14, 1988
Purchase Details
Closed on
Apr 27, 1988
Create a Home Valuation Report for This Property
The Home Valuation Report is an in-depth analysis detailing your home's value as well as a comparison with similar homes in the area
Home Values in the Area
Average Home Value in this Area
Purchase History
| Date | Buyer | Sale Price | Title Company |
|---|---|---|---|
| Huntleigh Co Holdings Llc-Series Da | $35,000 | Chicago Title | |
| Today S Bank | -- | None Available | |
| Trotter Estavion | -- | None Available | |
| -- | -- | -- | |
| -- | -- | -- | |
| -- | -- | -- | |
| -- | -- | -- |
Source: Public Records
Mortgage History
| Date | Status | Borrower | Loan Amount |
|---|---|---|---|
| Closed | Huntleigh Co Holdings Llc-Series Da | $76,532 |
Source: Public Records
Tax History Compared to Growth
Tax History
| Year | Tax Paid | Tax Assessment Tax Assessment Total Assessment is a certain percentage of the fair market value that is determined by local assessors to be the total taxable value of land and additions on the property. | Land | Improvement |
|---|---|---|---|---|
| 2024 | $676 | $11,076 | $360 | $10,716 |
| 2023 | $676 | $6,310 | $180 | $6,130 |
| 2022 | $647 | $6,010 | $180 | $5,830 |
| 2021 | $631 | $5,724 | $180 | $5,544 |
| 2020 | $593 | $5,451 | $180 | $5,271 |
| 2019 | $613 | $5,394 | $180 | $5,214 |
| 2018 | $578 | $5,137 | $180 | $4,957 |
| 2017 | $599 | $5,220 | $180 | $5,040 |
| 2016 | $590 | $5,301 | $180 | $5,121 |
| 2015 | -- | $4,863 | $180 | $4,683 |
| 2014 | -- | $4,731 | $180 | $4,551 |
Source: Public Records
Map
Nearby Homes
- 418 W Penn St
- 320 N Miles Ave
- 111 N Admire Ave
- 602 N Grand Ave
- 710 Sunset Dr
- 605 W Cheyenne St
- 211 S Ellison Ave
- 400 N Choctaw Ave
- 407 W Wade St
- 1108 W Hayes St
- 116 N Mahan Ave
- 421 N Barker Ave
- 506 S Evans Ave
- 420 N Barker Ave
- 0 Foreman Rd
- 520 S Hadden Ave
- 1117 W London St
- 120 N Macomb Ave
- 508 S Morrison Ave
- 312 E Wade St
- 604 W Rogers St
- 520 W Rogers St
- 608 W Rogers St
- 601 W Penn St
- 512 W Rogers St
- 312 N Miles Ave
- 611 W Rogers St
- 611 W Penn St
- 616 W Rogers St
- 508 W Rogers St
- 311 N Grand Ave
- 615 W Rogers St
- 618 W Rogers St
- 617 W Rogers St
- 617 W Penn St
- 619 W Penn St
- 501 W Penn St
- 619 W Rogers St
- 614 W Rogers St
- 600 W Penn St