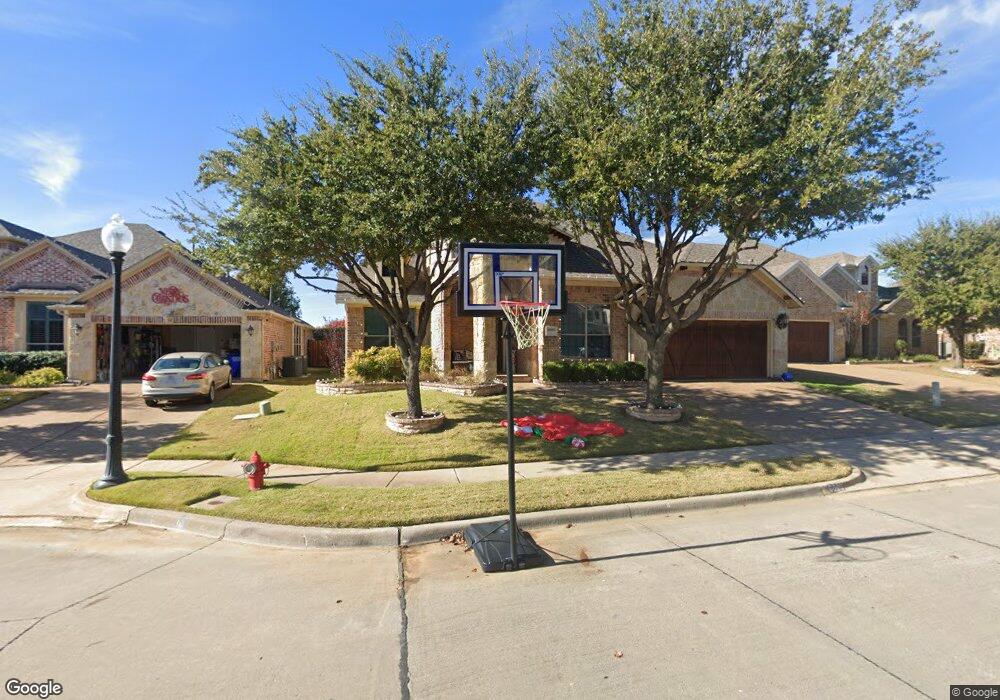
6000 Volterra Ct Colleyville, TX 76034
Estimated Value: $736,192 - $886,000
4
Beds
3
Baths
3,195
Sq Ft
$256/Sq Ft
Est. Value
About This Home
This home is located at 6000 Volterra Ct, Colleyville, TX 76034 and is currently estimated at $817,548, approximately $255 per square foot. 6000 Volterra Ct is a home located in Tarrant County with nearby schools including Colleyville Elementary School, Colleyville Middle School, and Grapevine High School.
Ownership History
Date
Name
Owned For
Owner Type
Purchase Details
Closed on
Feb 21, 2013
Sold by
Sanchez Alejandro and Sanchez Julie M
Bought by
Sacia Jonathan L and Sacia Nicole L
Current Estimated Value
Home Financials for this Owner
Home Financials are based on the most recent Mortgage that was taken out on this home.
Original Mortgage
$332,500
Outstanding Balance
$232,758
Interest Rate
3.44%
Mortgage Type
New Conventional
Estimated Equity
$584,790
Purchase Details
Closed on
Jun 16, 2006
Sold by
Stillbrooke Homes Of Texas Inc
Bought by
Sanchez Alejandro and Sanchez Julie M
Home Financials for this Owner
Home Financials are based on the most recent Mortgage that was taken out on this home.
Original Mortgage
$301,308
Interest Rate
6.58%
Mortgage Type
Fannie Mae Freddie Mac
Create a Home Valuation Report for This Property
The Home Valuation Report is an in-depth analysis detailing your home's value as well as a comparison with similar homes in the area
Home Values in the Area
Average Home Value in this Area
Purchase History
| Date | Buyer | Sale Price | Title Company |
|---|---|---|---|
| Sacia Jonathan L | -- | Old Republic Title | |
| Sacia Jonathan L | -- | Old Republic Title | |
| Sanchez Alejandro | -- | Atc |
Source: Public Records
Mortgage History
| Date | Status | Borrower | Loan Amount |
|---|---|---|---|
| Open | Sacia Jonathan L | $332,500 | |
| Closed | Sacia Jonathan L | $332,500 | |
| Previous Owner | Sanchez Alejandro | $301,308 |
Source: Public Records
Tax History Compared to Growth
Tax History
| Year | Tax Paid | Tax Assessment Tax Assessment Total Assessment is a certain percentage of the fair market value that is determined by local assessors to be the total taxable value of land and additions on the property. | Land | Improvement |
|---|---|---|---|---|
| 2025 | $3,528 | $731,517 | $76,300 | $655,217 |
| 2024 | $3,528 | $731,517 | $76,300 | $655,217 |
| 2023 | $10,499 | $622,411 | $76,300 | $546,111 |
| 2022 | $11,389 | $576,673 | $76,300 | $500,373 |
| 2021 | $9,241 | $420,787 | $90,000 | $330,787 |
| 2020 | $9,385 | $422,336 | $90,000 | $332,336 |
| 2019 | $10,083 | $436,135 | $90,000 | $346,135 |
| 2018 | $2,745 | $461,768 | $90,000 | $371,768 |
| 2017 | $10,950 | $463,485 | $90,000 | $373,485 |
| 2016 | $9,543 | $403,962 | $90,000 | $313,962 |
| 2015 | $8,910 | $384,500 | $60,000 | $324,500 |
| 2014 | $8,910 | $384,500 | $60,000 | $324,500 |
Source: Public Records
Map
Nearby Homes
- 6005 Valentino Ct
- 1315 Hardage Ln
- 6200 Pleasant Run Rd
- 1509 Tinker Rd
- Lot 4 Amelia Ct
- 5508 Coventry Ct
- 1813 Grosvenor Green
- 5317 Bluebonnet Dr
- 1521 Four Seasons Dr
- 1505 Four Seasons Dr
- 1504 Four Seasons Dr
- 1533 Four Seasons Dr
- 1536 Four Seasons Dr
- 1513 Four Seasons Dr
- Lot 3 Amelia Ct
- 1517 Four Seasons Dr
- 1525 Four Seasons Dr
- 1532 Four Seasons Dr
- 1512 Four Seasons Dr
- 5200 Preservation Ave
- 6004 Volterra Ct
- 1201 Tuscany Dr
- 1205 Tuscany Dr
- 6008 Volterra Ct
- 6001 Volterra Ct
- 6005 Volterra Ct
- 1209 Tuscany Dr
- 6012 Volterra Ct
- 1213 Tuscany Dr
- 6009 Volterra Ct
- 6013 Volterra Ct
- 6000 Valentino Ct
- 6004 Valentino Ct
- 1217 Tuscany Dr
- 6008 Valentino Ct
- 5810 Ponderosa St
- 5812 Ponderosa St
- 1221 Tuscany Dr
- 6012 Valentino Ct
- 5808 Ponderosa St