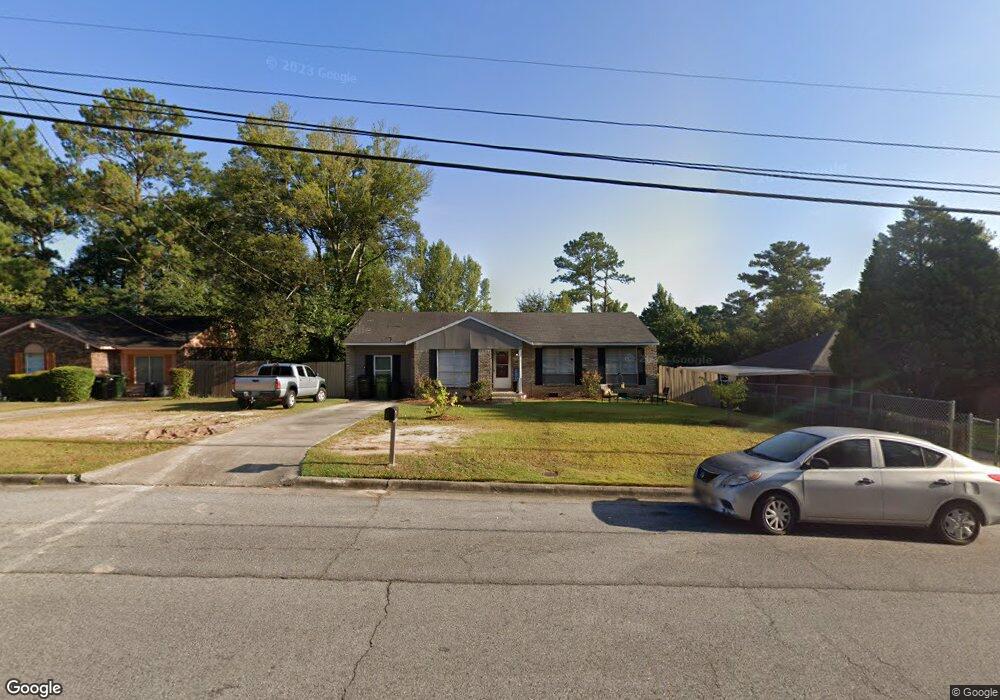
6001 Hunter Rd Columbus, GA 31907
East Columbus NeighborhoodEstimated Value: $105,000 - $154,000
3
Beds
2
Baths
1,400
Sq Ft
$98/Sq Ft
Est. Value
About This Home
This home is located at 6001 Hunter Rd, Columbus, GA 31907 and is currently estimated at $136,776, approximately $97 per square foot. 6001 Hunter Rd is a home located in Muscogee County with nearby schools including Wesley Heights Elementary School, Fort Middle School, and Kendrick High School.
Ownership History
Date
Name
Owned For
Owner Type
Purchase Details
Closed on
Aug 28, 2017
Sold by
Teel Amber
Bought by
Peterson Nedra S
Current Estimated Value
Home Financials for this Owner
Home Financials are based on the most recent Mortgage that was taken out on this home.
Original Mortgage
$87,878
Outstanding Balance
$74,292
Interest Rate
4.37%
Mortgage Type
FHA
Estimated Equity
$62,484
Purchase Details
Closed on
Feb 14, 2017
Sold by
Vfs Lending Svcs Vi Llc
Bought by
Teel Amber
Purchase Details
Closed on
Jan 25, 2017
Sold by
Vfs Lending Svcs Vi Llc
Bought by
Visio Financial Svcs Inc
Purchase Details
Closed on
Aug 2, 2016
Bought by
Vfs Lending Svcs Vi Llc
Purchase Details
Closed on
Mar 27, 2015
Sold by
Deutsche Bank National Trust C
Bought by
E D
Purchase Details
Closed on
Jul 1, 2014
Sold by
Mckissic Meatra
Bought by
Deutsche Bank National Trust C
Create a Home Valuation Report for This Property
The Home Valuation Report is an in-depth analysis detailing your home's value as well as a comparison with similar homes in the area
Home Values in the Area
Average Home Value in this Area
Purchase History
| Date | Buyer | Sale Price | Title Company |
|---|---|---|---|
| Peterson Nedra S | $89,500 | -- | |
| Teel Amber | $31,000 | -- | |
| Visio Financial Svcs Inc | -- | -- | |
| Teel Amber | -- | -- | |
| Vfs Lending Svcs Vi Llc | $35,000 | -- | |
| E D | -- | -- | |
| Deutsche Bank National Trust C | $49,215 | -- |
Source: Public Records
Mortgage History
| Date | Status | Borrower | Loan Amount |
|---|---|---|---|
| Open | Peterson Nedra S | $87,878 |
Source: Public Records
Tax History
| Year | Tax Paid | Tax Assessment Tax Assessment Total Assessment is a certain percentage of the fair market value that is determined by local assessors to be the total taxable value of land and additions on the property. | Land | Improvement |
|---|---|---|---|---|
| 2025 | $1,618 | $41,332 | $7,308 | $34,024 |
| 2024 | $1,618 | $41,332 | $7,308 | $34,024 |
| 2023 | $1,628 | $41,332 | $7,308 | $34,024 |
| 2022 | $1,508 | $36,936 | $7,308 | $29,628 |
| 2021 | $1,386 | $33,936 | $7,308 | $26,628 |
| 2020 | $1,386 | $33,936 | $7,308 | $26,628 |
| 2019 | $1,390 | $33,936 | $7,308 | $26,628 |
| 2018 | $1,390 | $33,936 | $7,308 | $26,628 |
| 2017 | $1,395 | $33,936 | $7,308 | $26,628 |
| 2016 | $1,364 | $33,071 | $4,898 | $28,173 |
| 2015 | $546 | $33,071 | $4,898 | $28,173 |
| 2014 | $1,367 | $33,071 | $4,898 | $28,173 |
| 2013 | -- | $33,071 | $4,898 | $28,173 |
Source: Public Records
Map
Nearby Homes
- 5773 Marlette Ct
- 5725 Marlette Ct
- 5525 Glenview Dr
- 6293 Dupree Dr
- 6311 Morning Dew Dr
- 6303 Morning Dew Dr
- 6302 Morning Dew Dr
- 6213 Fitzgerald Dr
- 5429 Susan Ln
- 2513 Lacey Oak Ct
- 2500 Water Oak Dr
- 6270 Mill Branch Rd
- 6021 Luna Dr
- 2672 Honeysuckle Dr
- 2807 Doyle Ave
- 5834 Blueridge Dr
- 6033 Luna Dr
- 5802 Blueridge Dr
- 6362 Lemongrass Dr
- 1925 Woodhollow Dr
Your Personal Tour Guide
Ask me questions while you tour the home.