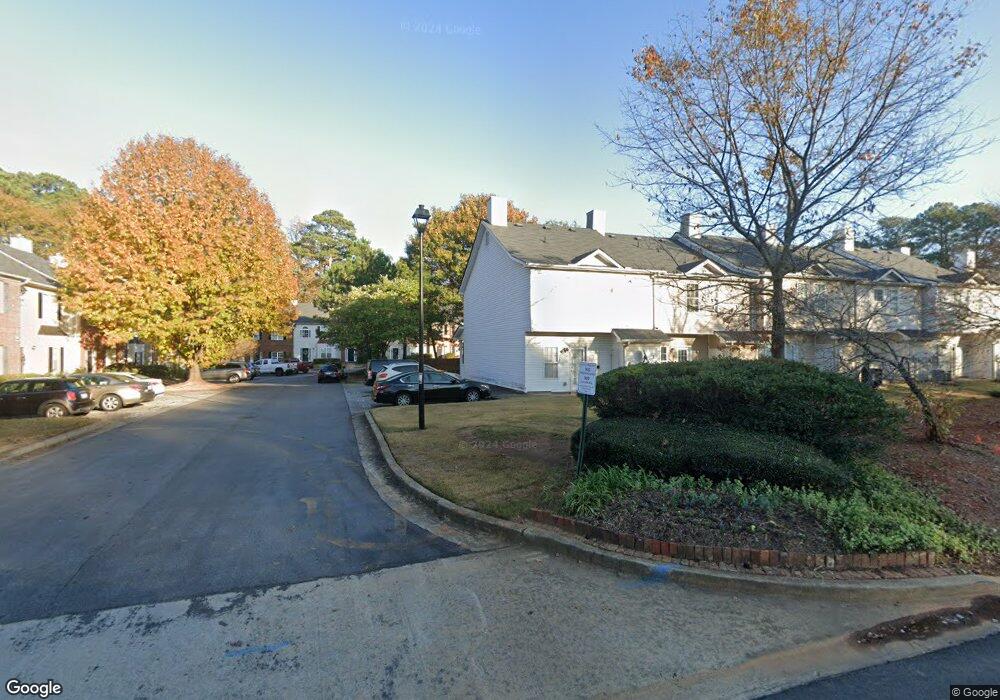
6001 Leeshire Trace Tucker, GA 30084
Estimated Value: $251,000 - $341,000
3
Beds
3
Baths
1,600
Sq Ft
$179/Sq Ft
Est. Value
About This Home
This home is located at 6001 Leeshire Trace, Tucker, GA 30084 and is currently estimated at $286,205, approximately $178 per square foot. 6001 Leeshire Trace is a home located in DeKalb County with nearby schools including Smoke Rise Elementary School, Tucker Middle School, and Tucker High School.
Ownership History
Date
Name
Owned For
Owner Type
Purchase Details
Closed on
May 13, 2024
Sold by
Embry Spring Anita
Bought by
Embry Spring Anita
Current Estimated Value
Home Financials for this Owner
Home Financials are based on the most recent Mortgage that was taken out on this home.
Original Mortgage
$187,500
Outstanding Balance
$184,698
Interest Rate
6.88%
Mortgage Type
New Conventional
Estimated Equity
$101,507
Purchase Details
Closed on
Aug 4, 2006
Sold by
Couchman Inga
Bought by
Eubanks-Butler Spring A
Home Financials for this Owner
Home Financials are based on the most recent Mortgage that was taken out on this home.
Original Mortgage
$139,000
Interest Rate
6.74%
Mortgage Type
New Conventional
Purchase Details
Closed on
Jun 23, 2003
Sold by
Knigcraft Homes Inc
Bought by
Couchman Inga
Home Financials for this Owner
Home Financials are based on the most recent Mortgage that was taken out on this home.
Original Mortgage
$131,300
Interest Rate
5.3%
Mortgage Type
New Conventional
Create a Home Valuation Report for This Property
The Home Valuation Report is an in-depth analysis detailing your home's value as well as a comparison with similar homes in the area
Home Values in the Area
Average Home Value in this Area
Purchase History
| Date | Buyer | Sale Price | Title Company |
|---|---|---|---|
| Embry Spring Anita | -- | -- | |
| Eubanks-Butler Spring A | $139,000 | -- | |
| Couchman Inga | $131,300 | -- |
Source: Public Records
Mortgage History
| Date | Status | Borrower | Loan Amount |
|---|---|---|---|
| Open | Embry Spring Anita | $187,500 | |
| Previous Owner | Eubanks-Butler Spring A | $139,000 | |
| Previous Owner | Couchman Inga | $131,300 |
Source: Public Records
Tax History Compared to Growth
Tax History
| Year | Tax Paid | Tax Assessment Tax Assessment Total Assessment is a certain percentage of the fair market value that is determined by local assessors to be the total taxable value of land and additions on the property. | Land | Improvement |
|---|---|---|---|---|
| 2025 | $4,322 | $94,720 | $20,000 | $74,720 |
| 2024 | $2,419 | $94,920 | $20,000 | $74,920 |
| 2023 | $2,419 | $95,680 | $20,000 | $75,680 |
| 2022 | $1,985 | $76,880 | $12,000 | $64,880 |
| 2021 | $1,645 | $60,960 | $12,000 | $48,960 |
| 2020 | $1,593 | $59,520 | $12,000 | $47,520 |
| 2019 | $1,551 | $58,600 | $12,000 | $46,600 |
| 2018 | $908 | $42,600 | $9,600 | $33,000 |
| 2017 | $1,075 | $41,080 | $9,600 | $31,480 |
| 2016 | $1,038 | $40,960 | $6,760 | $34,200 |
| 2014 | $484 | $24,760 | $6,760 | $18,000 |
Source: Public Records
Map
Nearby Homes
- 5099 Leeshire Trace
- 6003 Leeshire Trace
- 6003 Leeshire Trace Unit 32
- 6003 Leeshire Trace
- 5097 Leeshire Trace
- 6005 Leeshire Trace
- 6005 Leeshire Trace Unit 31
- 6007 Leeshire Trace
- 6007 Leeshire Trace Unit 6007
- 6009 Leeshire Trace Unit 6009
- 6009 Leeshire Trace
- 0 Leeshire Trace Unit 7041956
- 0 Leeshire Trace Unit 7014114
- 0 Leeshire Trace Unit 3225922
- 0 Leeshire Trace Unit 8281173
- 0 Leeshire Trace Unit 7622534
- 0 Leeshire Trace Unit 7321404
- 0 Leeshire Trace Unit 8643015
- 0 Leeshire Trace Unit 8307472
- 0 Leeshire Trace Unit 8206741