6001 Park Vista Dr Unit 2 South Ogden, UT 84405
Estimated Value: $764,000 - $1,062,879
5
Beds
3
Baths
2,484
Sq Ft
$369/Sq Ft
Est. Value
About This Home
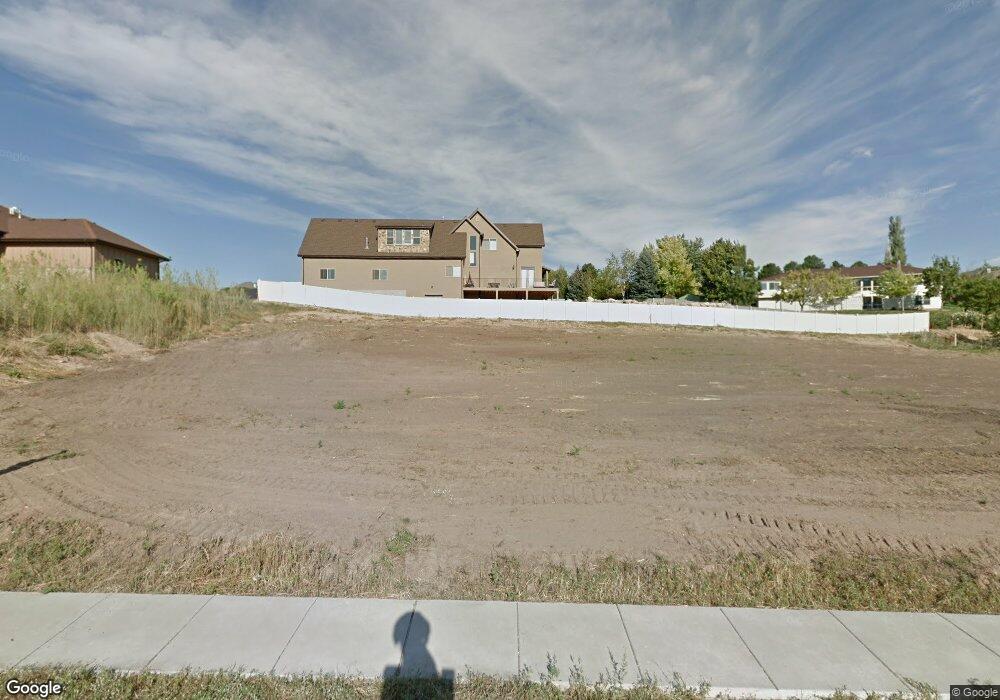
This home is located at 6001 Park Vista Dr Unit 2, South Ogden, UT 84405 and is currently estimated at $917,720, approximately $369 per square foot. 6001 Park Vista Dr Unit 2 is a home located in Weber County with nearby schools including H Guy Child School, South Ogden Junior High School, and Bonneville High School.
Ownership History
Date
Name
Owned For
Owner Type
Purchase Details
Closed on
May 23, 2017
Sold by
Hayes James Striker and Hayes Jan
Bought by
Hayes James S and Hayes Jan P
Current Estimated Value
Purchase Details
Closed on
Aug 15, 2014
Sold by
Crc Group Llc
Bought by
Eilertson Doug
Purchase Details
Closed on
Nov 26, 2013
Sold by
Bear Mountain Ranch Asset Management Llc
Bought by
Crc Group Llc
Purchase Details
Closed on
Nov 19, 2012
Sold by
Hansen John W and Venable Terry D
Bought by
Bear Mountain Ranch Asset Management Llc
Purchase Details
Closed on
Sep 14, 2011
Sold by
Park Vista Development Llc
Bought by
Hansen John W and Venable Terry D
Purchase Details
Closed on
Jan 24, 2007
Sold by
Brier Ridge Llc
Bought by
Park Vista Development Llc
Purchase Details
Closed on
Dec 27, 2006
Sold by
Green Edward D and Higley Mark L
Bought by
Brier Ridge Llc
Create a Home Valuation Report for This Property
The Home Valuation Report is an in-depth analysis detailing your home's value as well as a comparison with similar homes in the area
Home Values in the Area
Average Home Value in this Area
Purchase History
| Date | Buyer | Sale Price | Title Company |
|---|---|---|---|
| Hayes James S | -- | None Available | |
| Eilertson Doug | -- | Mountain View Title | |
| Crc Group Llc | -- | None Available | |
| Bear Mountain Ranch Asset Management Llc | -- | Mountain View Title | |
| Hansen John W | -- | Mountain View Title Ogden | |
| Park Vista Development Llc | -- | Accommodation | |
| Brier Ridge Llc | -- | Mountain View Title Ogden |
Source: Public Records
Tax History Compared to Growth
Tax History
| Year | Tax Paid | Tax Assessment Tax Assessment Total Assessment is a certain percentage of the fair market value that is determined by local assessors to be the total taxable value of land and additions on the property. | Land | Improvement |
|---|---|---|---|---|
| 2025 | $6,375 | $975,502 | $272,708 | $702,794 |
| 2024 | $6,090 | $523,599 | $150,134 | $373,465 |
| 2023 | $6,052 | $521,950 | $150,616 | $371,334 |
| 2022 | $6,572 | $582,450 | $150,616 | $431,834 |
| 2021 | $5,563 | $835,000 | $168,988 | $666,012 |
| 2020 | $5,070 | $711,000 | $149,246 | $561,754 |
| 2019 | $4,979 | $684,000 | $124,219 | $559,781 |
| 2018 | $5,357 | $690,000 | $124,219 | $565,781 |
| 2017 | $5,513 | $689,000 | $124,219 | $564,781 |
| 2016 | $2,977 | $205,940 | $68,346 | $137,594 |
| 2015 | $1,864 | $124,265 | $124,265 | $0 |
| 2014 | $1,903 | $125,924 | $125,924 | $0 |
Source: Public Records
Map
Nearby Homes
- 5760 S 1050 E
- 5791 Oakwood Dr
- 1325 E 6125 S Unit 24C
- 1014 E 5750 S
- 5698 S 1150 E
- 1091 E 5675 S
- 1046 E 5675 S
- 5643 S 1060 E
- 1389 E 5800 S
- 992 E 5625 S
- 1144 E 5675 S
- 1403 E 6175 S
- 964 E 5650 S
- 975 E 6600 S Unit 41
- 975 E 6600 S Unit 5
- 975 E 6600 S Unit 18
- 1411 E 6175 S
- 5584 S 975 E
- 5582 S 975 E
- 5575 S 1000 E
- 6001 Park Vista Dr
- 5996 Park Vista Dr Unit 5
- 5996 Park Vista Dr
- 5981 Park Vista Dr Unit 1
- 5981 Park Vista Dr
- 6010 Park Vista Dr Unit 3
- 6008 Park Vista Dr
- 6024 Park Vista Dr Unit 12
- 5990 Park Vista Dr
- 5990 Park Vista Dr Unit 6
- 5994 Park Vista Dr Unit 6
- 6028 Park Vista Dr
- 6028 Park Vista Dr Unit 4
- 5994 Park Vista Dr
- 1095 E 5950 S
- 1091 E 5950 S
- 5976 Park Vista Dr
- 6005 Park Vista Dr
- 5993 Park Vista Dr Unit 7
- 6005 Park Vista Dr Unit 8