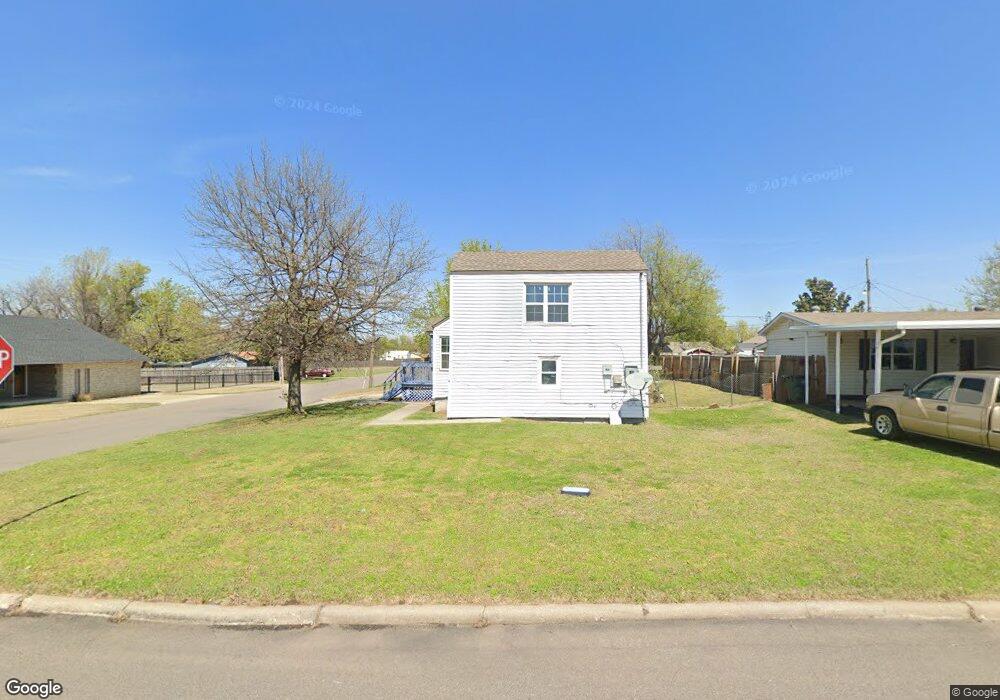
6001 SE 7th St Oklahoma City, OK 73110
Estimated Value: $134,000 - $152,000
3
Beds
2
Baths
940
Sq Ft
$151/Sq Ft
Est. Value
About This Home
This home is located at 6001 SE 7th St, Oklahoma City, OK 73110 and is currently estimated at $141,839, approximately $150 per square foot. 6001 SE 7th St is a home located in Oklahoma County with nearby schools including Midwest City Elementary School, Midwest City Middle School, and Midwest City High School.
Ownership History
Date
Name
Owned For
Owner Type
Purchase Details
Closed on
Aug 23, 2022
Sold by
Kd Real Estate Solutions Llc
Bought by
Narula Rajesh K and Narula Raj K
Current Estimated Value
Purchase Details
Closed on
Jun 17, 2021
Sold by
Peavey Kevin D
Bought by
Kd Real Estate Solutions Llc
Purchase Details
Closed on
Jun 15, 2021
Sold by
County Of Oklahoma
Bought by
Peavey Kevin D
Purchase Details
Closed on
Mar 7, 2005
Sold by
Narula Rajesh K and Narula Raj K
Bought by
Narula Rajesh K and Narula Raj K
Purchase Details
Closed on
Oct 18, 2000
Sold by
Claridge Timothy Mark and Claridge Yvonna
Bought by
Thomas Joseph M and Thomas Mareenamma M
Create a Home Valuation Report for This Property
The Home Valuation Report is an in-depth analysis detailing your home's value as well as a comparison with similar homes in the area
Home Values in the Area
Average Home Value in this Area
Purchase History
| Date | Buyer | Sale Price | Title Company |
|---|---|---|---|
| Narula Rajesh K | -- | -- | |
| Kd Real Estate Solutions Llc | -- | -- | |
| Peavey Kevin D | $43,400 | None Available | |
| Narula Rajesh K | -- | -- | |
| Thomas Joseph M | $6,000 | Lawyers Title |
Source: Public Records
Tax History Compared to Growth
Tax History
| Year | Tax Paid | Tax Assessment Tax Assessment Total Assessment is a certain percentage of the fair market value that is determined by local assessors to be the total taxable value of land and additions on the property. | Land | Improvement |
|---|---|---|---|---|
| 2024 | $1,074 | $9,580 | $2,453 | $7,127 |
| 2023 | $1,074 | $9,124 | $1,677 | $7,447 |
| 2022 | $1,014 | $8,690 | $1,819 | $6,871 |
| 2021 | $720 | $6,025 | $1,434 | $4,591 |
| 2020 | $614 | $5,005 | $1,819 | $3,186 |
| 2019 | $607 | $5,170 | $1,790 | $3,380 |
| 2018 | $685 | $6,215 | $0 | $0 |
| 2017 | $671 | $5,994 | $1,790 | $4,204 |
| 2016 | $658 | $5,719 | $1,790 | $3,929 |
| 2015 | $678 | $5,657 | $1,609 | $4,048 |
| 2014 | $670 | $5,596 | $1,609 | $3,987 |
Source: Public Records
Map
Nearby Homes