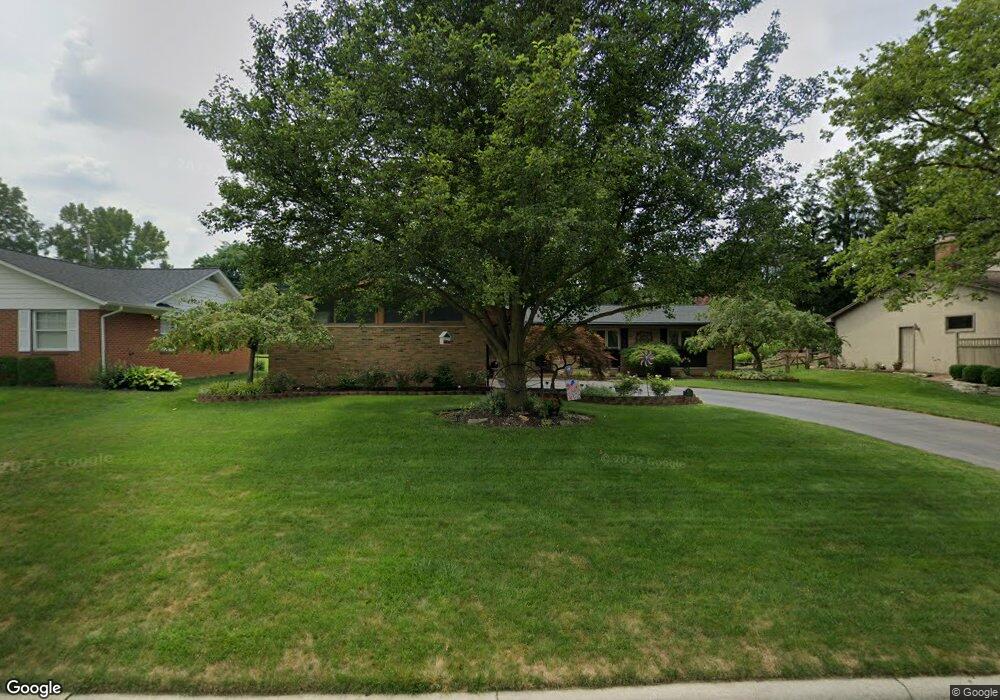
6001 Tulip Hill Rd Columbus, OH 43235
Indian Hills NeighborhoodEstimated Value: $425,910 - $505,000
3
Beds
2
Baths
1,860
Sq Ft
$246/Sq Ft
Est. Value
About This Home
This home is located at 6001 Tulip Hill Rd, Columbus, OH 43235 and is currently estimated at $458,228, approximately $246 per square foot. 6001 Tulip Hill Rd is a home located in Franklin County with nearby schools including Gables Elementary School, Ridgeview Middle School, and Centennial High School.
Ownership History
Date
Name
Owned For
Owner Type
Purchase Details
Closed on
Jul 1, 2011
Sold by
Phillips Helen D
Bought by
Phillips Helen D and Phillips Paul R
Current Estimated Value
Purchase Details
Closed on
Aug 9, 2005
Sold by
Rini James N and Rini Rhonda A
Bought by
Phillips Helen D
Home Financials for this Owner
Home Financials are based on the most recent Mortgage that was taken out on this home.
Original Mortgage
$180,000
Interest Rate
5.69%
Mortgage Type
Fannie Mae Freddie Mac
Purchase Details
Closed on
Oct 20, 2004
Sold by
Estate Of Gloria J Rini
Bought by
Rini James N
Purchase Details
Closed on
Mar 28, 2000
Sold by
Estate Of William R Rini
Bought by
Rini James N
Purchase Details
Closed on
May 18, 1964
Bought by
Rini William R
Create a Home Valuation Report for This Property
The Home Valuation Report is an in-depth analysis detailing your home's value as well as a comparison with similar homes in the area
Home Values in the Area
Average Home Value in this Area
Purchase History
| Date | Buyer | Sale Price | Title Company |
|---|---|---|---|
| Phillips Helen D | -- | Attorney | |
| Phillips Helen D | $230,000 | Marketable | |
| Rini James N | -- | -- | |
| Rini James N | -- | -- | |
| Rini William R | -- | -- |
Source: Public Records
Mortgage History
| Date | Status | Borrower | Loan Amount |
|---|---|---|---|
| Previous Owner | Phillips Helen D | $180,000 |
Source: Public Records
Tax History Compared to Growth
Tax History
| Year | Tax Paid | Tax Assessment Tax Assessment Total Assessment is a certain percentage of the fair market value that is determined by local assessors to be the total taxable value of land and additions on the property. | Land | Improvement |
|---|---|---|---|---|
| 2024 | $5,708 | $127,190 | $55,440 | $71,750 |
| 2023 | $5,635 | $127,190 | $55,440 | $71,750 |
| 2022 | $5,246 | $101,150 | $31,500 | $69,650 |
| 2021 | $5,255 | $101,150 | $31,500 | $69,650 |
| 2020 | $5,262 | $101,150 | $31,500 | $69,650 |
| 2019 | $4,875 | $80,360 | $25,200 | $55,160 |
| 2018 | $4,708 | $80,360 | $25,200 | $55,160 |
| 2017 | $4,942 | $80,360 | $25,200 | $55,160 |
| 2016 | $5,013 | $75,670 | $20,720 | $54,950 |
| 2015 | $4,550 | $75,670 | $20,720 | $54,950 |
| 2014 | $4,561 | $75,670 | $20,720 | $54,950 |
| 2013 | $2,143 | $72,065 | $19,740 | $52,325 |
Source: Public Records
Map
Nearby Homes
- 6041 Rocky Rill Rd
- 5881 Rocky Rill Rd
- 838 Cambridge Ct
- 5854 Aqua Bay Dr Unit 5854
- 5938 Aqua Bay Dr
- 5936 Aqua Bay Dr
- 6105 Flora Villa Dr
- 5773 Middlefield Dr
- 962 Augusta Glen Dr
- 6577 Plesenton Dr S
- 895 Linworth Village Dr
- 928 Linworth Village Dr
- 1037 Ravine Ridge Dr
- 1505 Eastmeadow Place
- 301 W Riverglen Dr
- 1307 Lakeside Ct
- 511 W Kanawha Ave
- 1246 Southport Dr
- 5016 Postlewaite Rd Unit 5016
- 784 Pinecliff Place
- 6013 Tulip Hill Rd
- 5987 Tulip Hill Rd
- 6000 Winstead Rd
- 6012 Winstead Rd
- 6025 Tulip Hill Rd
- 5975 Tulip Hill Rd
- 973 Lynbrook Rd
- 6026 Winstead Rd
- 5984 Winstead Rd
- 5984 Tulip Hill Rd
- 6038 Winstead Rd
- 972 Lynbrook Rd
- 5972 Tulip Hill Rd
- 5963 Tulip Hill Rd
- 6037 Tulip Hill Rd
- 5970 Winstead Rd
- 961 Lynbrook Rd
- 6044 Winstead Rd
- 6030 Tulip Hill Rd
- 5960 Tulip Hill Rd