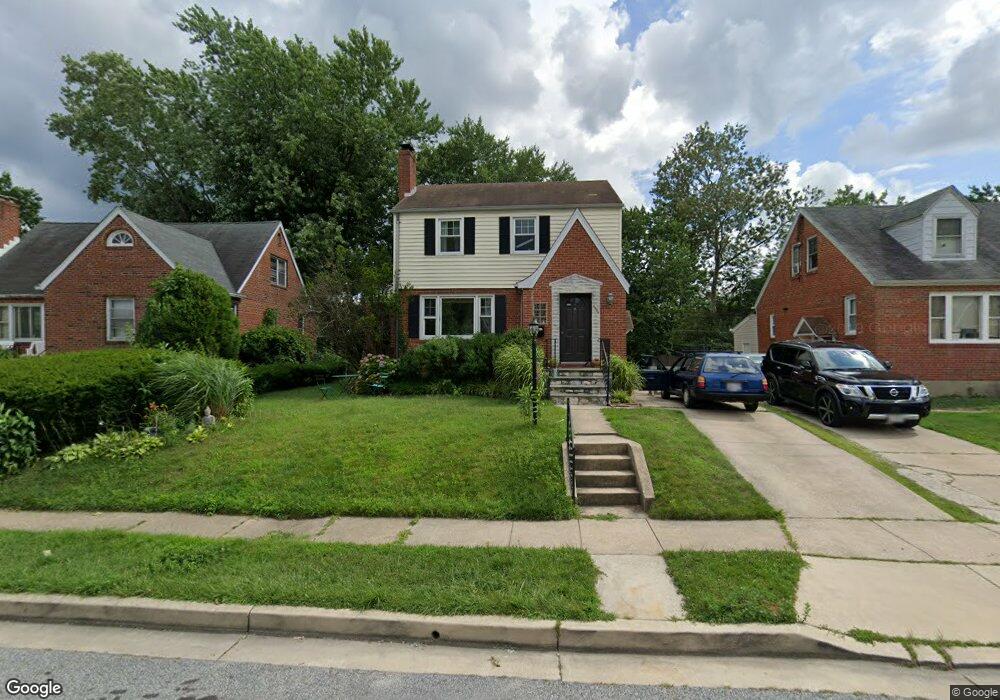
6002 Mannington Ave Baltimore, MD 21206
Estimated Value: $208,000 - $297,867
3
Beds
2
Baths
1,232
Sq Ft
$213/Sq Ft
Est. Value
About This Home
This home is located at 6002 Mannington Ave, Baltimore, MD 21206 and is currently estimated at $262,467, approximately $213 per square foot. 6002 Mannington Ave is a home located in Baltimore County with nearby schools including Elmwood Elementary School, Parkville Middle & Center of Technology, and Overlea High School.
Ownership History
Date
Name
Owned For
Owner Type
Purchase Details
Closed on
Jun 18, 2010
Sold by
Veader Nathan
Bought by
Veader Nathan and Veader Kathryn
Current Estimated Value
Purchase Details
Closed on
Nov 30, 2005
Sold by
Mazursky Jeffrey A
Bought by
Veader Nathan
Home Financials for this Owner
Home Financials are based on the most recent Mortgage that was taken out on this home.
Original Mortgage
$159,200
Interest Rate
5.12%
Mortgage Type
Adjustable Rate Mortgage/ARM
Purchase Details
Closed on
Aug 7, 2001
Sold by
Morris Yvonne C
Bought by
Mazursky Jeffrey A
Purchase Details
Closed on
Apr 13, 1999
Sold by
Kearns Larry R
Bought by
Morris Yvonne C
Purchase Details
Closed on
Jan 12, 1994
Sold by
Myers Norvin F
Bought by
Kearns Larry R
Home Financials for this Owner
Home Financials are based on the most recent Mortgage that was taken out on this home.
Original Mortgage
$107,559
Interest Rate
7.22%
Create a Home Valuation Report for This Property
The Home Valuation Report is an in-depth analysis detailing your home's value as well as a comparison with similar homes in the area
Home Values in the Area
Average Home Value in this Area
Purchase History
| Date | Buyer | Sale Price | Title Company |
|---|---|---|---|
| Veader Nathan | -- | -- | |
| Veader Nathan | $197,000 | -- | |
| Mazursky Jeffrey A | $122,000 | -- | |
| Morris Yvonne C | -- | -- | |
| Kearns Larry R | $107,900 | -- |
Source: Public Records
Mortgage History
| Date | Status | Borrower | Loan Amount |
|---|---|---|---|
| Previous Owner | Veader Nathan | $159,200 | |
| Previous Owner | Veader Nathan | $39,800 | |
| Previous Owner | Kearns Larry R | $107,559 |
Source: Public Records
Tax History
| Year | Tax Paid | Tax Assessment Tax Assessment Total Assessment is a certain percentage of the fair market value that is determined by local assessors to be the total taxable value of land and additions on the property. | Land | Improvement |
|---|---|---|---|---|
| 2025 | $3,049 | $208,033 | -- | -- |
| 2024 | $3,049 | $192,567 | $0 | $0 |
| 2023 | $2,822 | $177,100 | $61,800 | $115,300 |
| 2022 | $2,756 | $173,867 | $0 | $0 |
| 2021 | $2,665 | $170,633 | $0 | $0 |
| 2020 | $2,665 | $167,400 | $61,800 | $105,600 |
| 2019 | $2,656 | $163,333 | $0 | $0 |
| 2018 | $3,274 | $159,267 | $0 | $0 |
| 2017 | $2,656 | $155,200 | $0 | $0 |
| 2016 | $2,380 | $155,200 | $0 | $0 |
| 2015 | $2,380 | $155,200 | $0 | $0 |
| 2014 | $2,380 | $173,400 | $0 | $0 |
Source: Public Records
Map
Nearby Homes
- 6121 Marglenn Ave
- 5819 Westwood Ave
- 5944 Clayton Ave
- 4412 Springwood Ave
- 5943 Clayton Ave
- 4510 Forest View Ave
- 4422 Forest View Ave
- 417 Meadow Rd
- 4219 Parkmont Ave
- 4602 Glenarm Ave
- 4211 Parkmont Ave
- 5909 Marluth Ave
- 4203 Springwood Ave
- 4503 Glenarm Ave
- 4600 White Ave
- 4103 Glenmore Ave
- 4705 Bayonne Ave
- 5727 Utrecht Rd
- 5522 Mccormick Ave
- 4600 Bayonne Ave
- 6004 Mannington Ave
- 6000 Mannington Ave
- 0 Plainfield Ave Unit BA8661155
- 6006 Mannington Ave
- 5848 Westwood Ave
- 6008 Mannington Ave
- 6001 Westwood Ave
- 6001 Mannington Ave
- 5846 Westwood Ave
- 6003 Mannington Ave
- 6000 Westwood Ave
- 6005 Mannington Ave
- 6010 Mannington Ave
- 6003 Westwood Ave
- 6007 Mannington Ave
- 5844 Westwood Ave
- 5901 Westwood Ave
- 6002 Westwood Ave
- 6009 Mannington Ave
- 6012 Mannington Ave
Your Personal Tour Guide
Ask me questions while you tour the home.