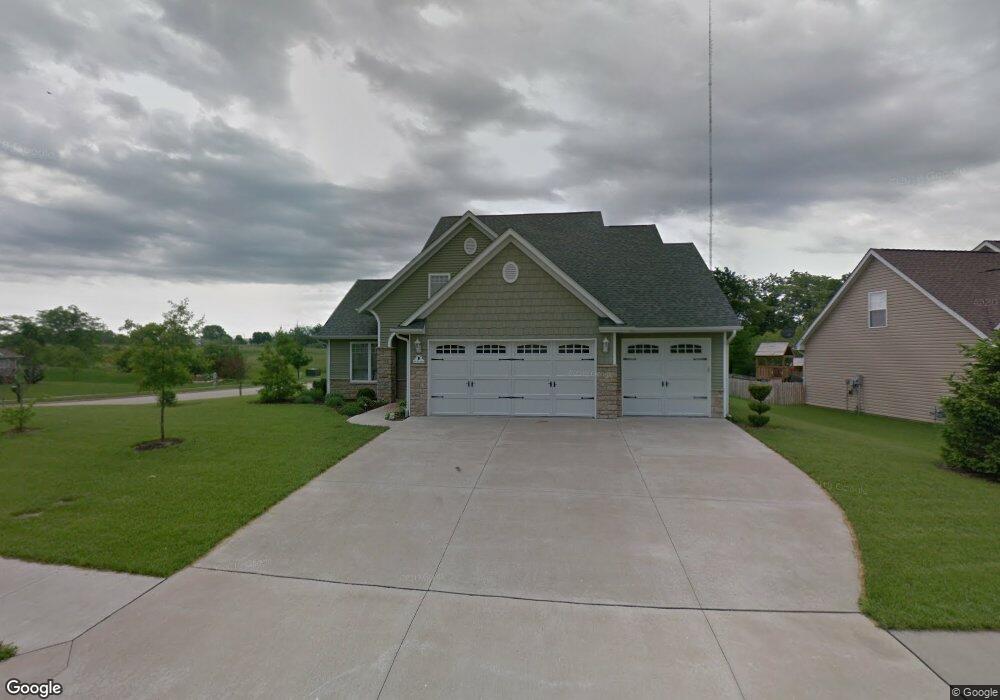
6002 Misty Spring Way Columbia, MO 65202
Estimated Value: $357,000 - $386,000
3
Beds
3
Baths
2,077
Sq Ft
$178/Sq Ft
Est. Value
About This Home
This home is located at 6002 Misty Spring Way, Columbia, MO 65202 and is currently estimated at $369,444, approximately $177 per square foot. 6002 Misty Spring Way is a home located in Boone County with nearby schools including Alpha Hart Lewis Elementary School, John B. Lange Middle School, and Muriel W. Battle High School.
Ownership History
Date
Name
Owned For
Owner Type
Purchase Details
Closed on
Dec 15, 2023
Sold by
Chown Brett K
Bought by
Chown Brett K and Lilly Grace E
Current Estimated Value
Purchase Details
Closed on
May 24, 2019
Sold by
Mains Staci Renee and Mains Cody Adam
Bought by
Chown Brett and Chown Mary Beth
Home Financials for this Owner
Home Financials are based on the most recent Mortgage that was taken out on this home.
Original Mortgage
$184,000
Interest Rate
4.1%
Mortgage Type
New Conventional
Purchase Details
Closed on
Sep 15, 2015
Sold by
Luetkemeyer Perry A and Luetkemeyer Rebekah
Bought by
Mains Staci Renee and Mains Adam
Home Financials for this Owner
Home Financials are based on the most recent Mortgage that was taken out on this home.
Original Mortgage
$186,600
Interest Rate
3.87%
Mortgage Type
Adjustable Rate Mortgage/ARM
Purchase Details
Closed on
Nov 22, 2006
Sold by
Premier Llc
Bought by
Luetemeyer Perry A and Luetemeyer Rebekah
Create a Home Valuation Report for This Property
The Home Valuation Report is an in-depth analysis detailing your home's value as well as a comparison with similar homes in the area
Home Values in the Area
Average Home Value in this Area
Purchase History
| Date | Buyer | Sale Price | Title Company |
|---|---|---|---|
| Chown Brett K | -- | None Listed On Document | |
| Chown Brett | -- | Boone Central Title Co | |
| Mains Staci Renee | -- | Boone Central Title Co | |
| Luetemeyer Perry A | -- | None Available |
Source: Public Records
Mortgage History
| Date | Status | Borrower | Loan Amount |
|---|---|---|---|
| Previous Owner | Chown Brett | $184,000 | |
| Previous Owner | Mains Staci Renee | $186,600 |
Source: Public Records
Tax History Compared to Growth
Tax History
| Year | Tax Paid | Tax Assessment Tax Assessment Total Assessment is a certain percentage of the fair market value that is determined by local assessors to be the total taxable value of land and additions on the property. | Land | Improvement |
|---|---|---|---|---|
| 2025 | $2,793 | $47,405 | $5,700 | $41,705 |
| 2024 | $2,793 | $41,401 | $5,700 | $35,701 |
| 2023 | $2,770 | $41,401 | $5,700 | $35,701 |
| 2022 | $2,660 | $39,805 | $5,700 | $34,105 |
| 2021 | $2,665 | $39,805 | $5,700 | $34,105 |
| 2020 | $2,837 | $39,805 | $5,700 | $34,105 |
| 2019 | $2,837 | $39,805 | $5,700 | $34,105 |
| 2018 | $2,856 | $0 | $0 | $0 |
| 2017 | $2,822 | $39,805 | $5,700 | $34,105 |
| 2016 | $2,817 | $39,805 | $5,700 | $34,105 |
| 2015 | $2,587 | $39,805 | $5,700 | $34,105 |
| 2014 | $2,595 | $39,805 | $5,700 | $34,105 |
Source: Public Records
Map
Nearby Homes
- 5911 Misty Springs Way
- 3703 Chestnut Dr
- 5828 Misty Springs Way
- 3520 Honey Shoal Dr
- 3504 Delwood Dr
- 3412 Jagged Leaf Dr
- 3408 Jagged Leaf Dr
- 5901 Harvest Leaf Dr
- 5813 Harvest Leaf Dr
- 5805 Harvest Leaf Dr
- 4180 E Lang Dr
- LOT # 4 N Route B
- 3511 Tuscany Ridge
- 3516 Napoli Dr
- 3501 Napoli Dr
- 3409 Napoli Dr
- 3241 Napoli Dr
- 3432 San Marco Dr
- 3239 Napoli Dr
- 3307 Naples Dr
- 6002 Misty Springs Way
- 6000 Misty Springs Way
- 6000 Misty Spring Way
- L 227 Flatwater Dr
- L 224 Flatwater Dr
- L 207 Flatwater Dr
- L 226 Flatwater Dr
- L 225 Flatwater Dr
- L 205 Flatwater Dr
- L 204 Flatwater Dr
- L 202 Flatwater Dr
- L 223 Flatwater Dr
- L 201 Flatwater Dr
- L 222 Flatwater Dr
- L 231 Flatwater Dr
- L 221 Flatwater Dr
- L 217 Flatwater Dr
- L 219 Flatwater Dr
- L 214 Flatwater Dr
- L 212 Flatwater Dr