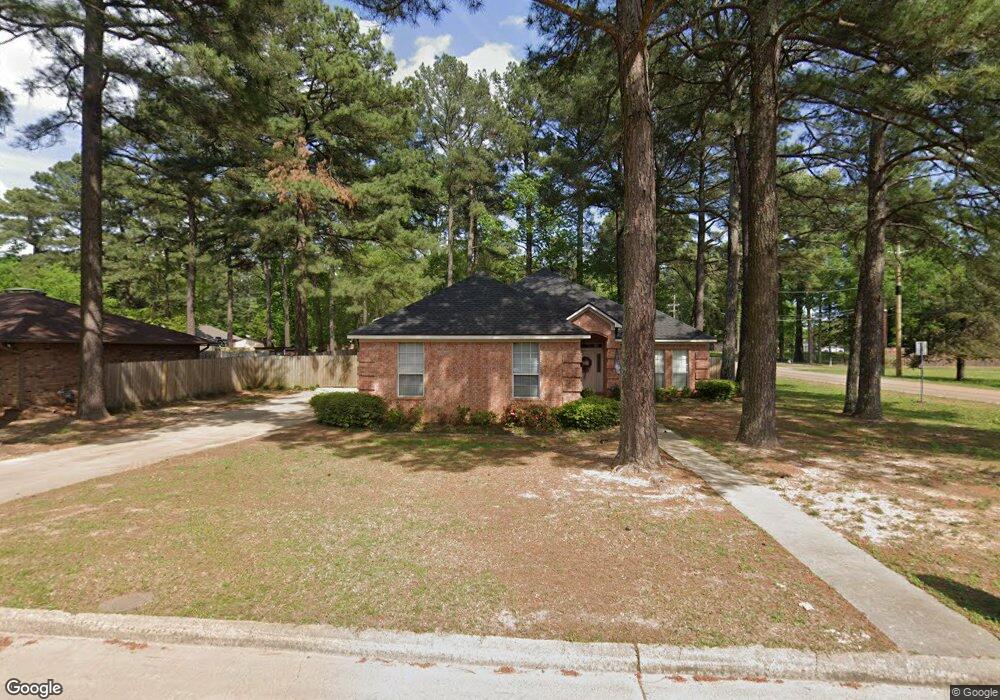
6002 Ruston Rd Texarkana, TX 75503
Estimated Value: $266,550 - $304,000
3
Beds
2
Baths
2,143
Sq Ft
$132/Sq Ft
Est. Value
About This Home
This home is located at 6002 Ruston Rd, Texarkana, TX 75503 and is currently estimated at $283,138, approximately $132 per square foot. 6002 Ruston Rd is a home located in Bowie County with nearby schools including Waggoner Creek Elementary School, Texas Middle School, and Texas High School.
Ownership History
Date
Name
Owned For
Owner Type
Purchase Details
Closed on
Sep 15, 2015
Sold by
Ward Marla D
Bought by
Mcfall Donald Ray and Mcfall Kelly L
Current Estimated Value
Home Financials for this Owner
Home Financials are based on the most recent Mortgage that was taken out on this home.
Original Mortgage
$140,125
Outstanding Balance
$110,284
Interest Rate
3.97%
Mortgage Type
New Conventional
Estimated Equity
$172,854
Create a Home Valuation Report for This Property
The Home Valuation Report is an in-depth analysis detailing your home's value as well as a comparison with similar homes in the area
Purchase History
| Date | Buyer | Sale Price | Title Company |
|---|---|---|---|
| Mcfall Donald Ray | $140,125 | None Available |
Source: Public Records
Mortgage History
| Date | Status | Borrower | Loan Amount |
|---|---|---|---|
| Open | Mcfall Donald Ray | $140,125 |
Source: Public Records
Tax History
| Year | Tax Paid | Tax Assessment Tax Assessment Total Assessment is a certain percentage of the fair market value that is determined by local assessors to be the total taxable value of land and additions on the property. | Land | Improvement |
|---|---|---|---|---|
| 2025 | $3,944 | $247,752 | -- | -- |
| 2024 | $53 | $225,229 | $25,000 | $232,736 |
| 2023 | $4,848 | $204,754 | $0 | $0 |
| 2022 | $4,443 | $225,136 | $25,000 | $200,136 |
| 2021 | $4,327 | $169,218 | $15,000 | $154,218 |
| 2020 | $4,166 | $162,054 | $15,000 | $147,054 |
| 2019 | $4,141 | $155,243 | $15,000 | $140,243 |
| 2018 | $4,001 | $149,994 | $15,000 | $134,994 |
| 2017 | $3,922 | $147,429 | $15,000 | $132,429 |
| 2016 | $3,922 | $147,429 | $15,000 | $132,429 |
| 2015 | $3,655 | $146,168 | $15,000 | $131,168 |
| 2014 | $3,655 | $141,272 | $15,000 | $126,272 |
Source: Public Records
Map
Nearby Homes
- 1521 Moores Ln
- 5615 Century Ln
- 6404 N Park Rd
- 5808 Winchester Dr
- 5818 Winchester Dr
- 5906 Winchester Dr
- 17 Enclave Cir
- 46 Enclave Cir
- 10 Enclave Cir
- 4 Enclave Cir
- 36 Enclave Cir
- 30 Enclave Cir
- 34 Enclave Cir
- 6 Enclave Cir
- 3 Enclave Cir
- 32 Enclave Cir
- TBD Jordan Ln
- 78 Valley Rd
- 25 Shields Ct
- 24 Shields Ct
Your Personal Tour Guide
Ask me questions while you tour the home.