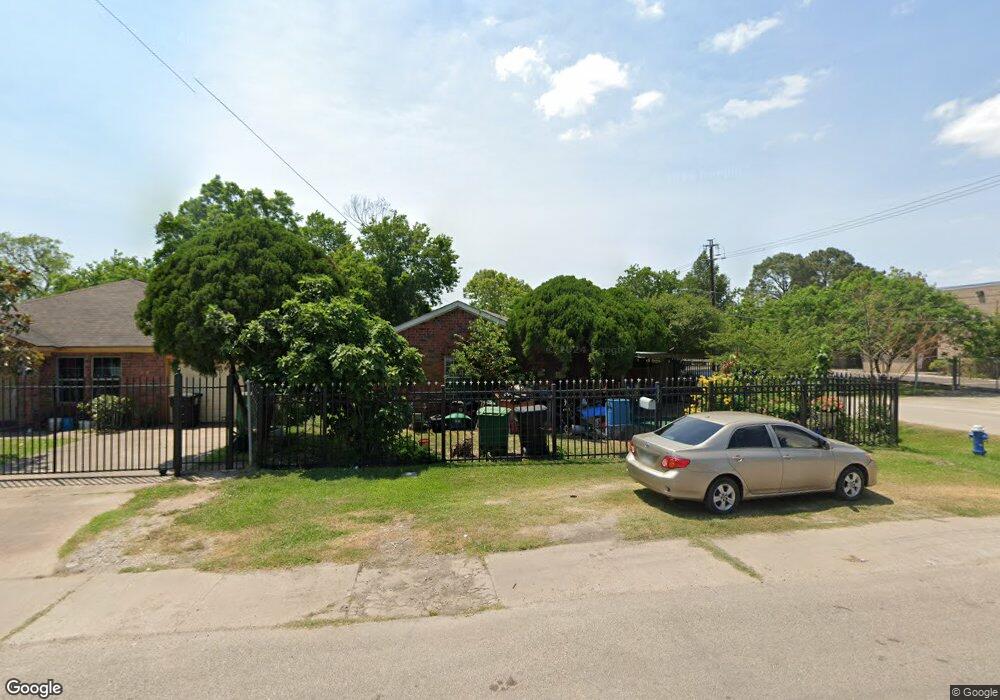
6002 Sidney St Houston, TX 77021
OST-South Union NeighborhoodEstimated Value: $199,951 - $245,000
3
Beds
2
Baths
1,236
Sq Ft
$182/Sq Ft
Est. Value
About This Home
This home is located at 6002 Sidney St, Houston, TX 77021 and is currently estimated at $224,988, approximately $182 per square foot. 6002 Sidney St is a home located in Harris County with nearby schools including Peck Elementary School, Cullen Middle School, and Yates High School.
Ownership History
Date
Name
Owned For
Owner Type
Purchase Details
Closed on
Nov 21, 2000
Sold by
Batalla Leopoldo Ramirez
Bought by
Quintana Raymundo and Quintana Eleazar
Current Estimated Value
Home Financials for this Owner
Home Financials are based on the most recent Mortgage that was taken out on this home.
Original Mortgage
$65,950
Outstanding Balance
$24,024
Interest Rate
7.72%
Estimated Equity
$200,964
Purchase Details
Closed on
Jan 26, 2000
Sold by
Bender King Inc
Bought by
Batalla Leopoldo Ramirez
Home Financials for this Owner
Home Financials are based on the most recent Mortgage that was taken out on this home.
Original Mortgage
$66,900
Interest Rate
7.86%
Purchase Details
Closed on
Jul 21, 1999
Sold by
King Alicia
Bought by
Bender King Inc and Avantgarde Homes
Home Financials for this Owner
Home Financials are based on the most recent Mortgage that was taken out on this home.
Original Mortgage
$52,000
Interest Rate
7.47%
Mortgage Type
Construction
Create a Home Valuation Report for This Property
The Home Valuation Report is an in-depth analysis detailing your home's value as well as a comparison with similar homes in the area
Home Values in the Area
Average Home Value in this Area
Purchase History
| Date | Buyer | Sale Price | Title Company |
|---|---|---|---|
| Quintana Raymundo | -- | -- | |
| Batalla Leopoldo Ramirez | -- | Commerce Land Title | |
| Bender King Inc | -- | Commerce Land Title |
Source: Public Records
Mortgage History
| Date | Status | Borrower | Loan Amount |
|---|---|---|---|
| Open | Quintana Raymundo | $65,950 | |
| Previous Owner | Batalla Leopoldo Ramirez | $66,900 | |
| Previous Owner | Bender King Inc | $52,000 | |
| Closed | Quintana Raymundo | $3,500 |
Source: Public Records
Tax History Compared to Growth
Tax History
| Year | Tax Paid | Tax Assessment Tax Assessment Total Assessment is a certain percentage of the fair market value that is determined by local assessors to be the total taxable value of land and additions on the property. | Land | Improvement |
|---|---|---|---|---|
| 2025 | $1,678 | $240,569 | $90,000 | $150,569 |
| 2024 | $1,678 | $230,867 | $90,000 | $140,867 |
| 2023 | $1,678 | $237,084 | $90,000 | $147,084 |
| 2022 | $2,764 | $219,912 | $70,000 | $149,912 |
| 2021 | $2,659 | $175,764 | $45,000 | $130,764 |
| 2020 | $2,512 | $119,729 | $30,000 | $89,729 |
| 2019 | $2,386 | $102,452 | $25,000 | $77,452 |
| 2018 | $1,442 | $106,245 | $20,000 | $86,245 |
| 2017 | $1,971 | $106,245 | $20,000 | $86,245 |
| 2016 | $1,791 | $90,539 | $20,000 | $70,539 |
| 2015 | $1,031 | $86,297 | $20,000 | $66,297 |
| 2014 | $1,031 | $58,552 | $12,500 | $46,052 |
Source: Public Records
Map
Nearby Homes
- 6019 England St
- 5920 Conley St
- 4103 Dixie Dr
- 4101 Dixie Dr
- 4209 Short St
- 5908 Saint Augustine St Unit B
- 5908 Saint Augustine St Unit C
- 6135 Sidney St
- 4015 Porter St
- 6202 Conley St
- 6208 Sidney St
- 5811 Eastwood St
- 4504 Kingsbury St
- 4014 England Ct E
- 3939 Tristan St
- 4013 Griggs Rd Unit E
- 4013 Griggs Rd Unit D
- 6305 Eastwood St
- 0 Sidney St Unit 28682136
- 7131 Cullen Blvd
- 6006 Sidney St
- 6000 England St
- 6010 Sidney St
- 6003 England St
- 6007 England St
- 6014 Sidney St
- 6020 Sidney St
- 6028 Sidney St
- 6004 England St Unit A /B
- 6004 England St Unit A and B
- 6004 England St Unit A
- 6004 England St
- 6004 England St Unit B
- 6006 England St
- 5928 England St
- 6030 Sidney St
- 5926 England St
- 6025 England St
- 5920 England St
- 6034 Sidney St