Estimated Value: $184,000 - $200,000
4
Beds
3
Baths
1,616
Sq Ft
$118/Sq Ft
Est. Value
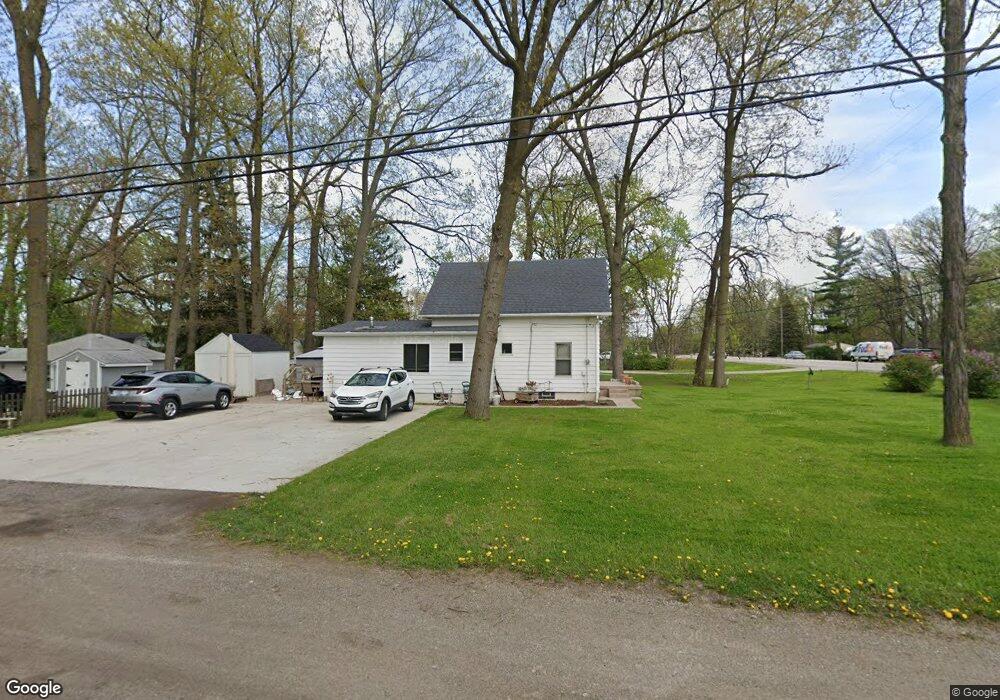
About This Home
This home is located at 6004 Corunna Rd Unit Bldg-Unit, Flint, MI 48532 and is currently estimated at $191,469, approximately $118 per square foot. 6004 Corunna Rd Unit Bldg-Unit is a home located in Genesee County with nearby schools including Carman-Ainsworth High School, Genesee STEM Academy, and First Flint Seventh-day Adventist Christian School.
Ownership History
Date
Name
Owned For
Owner Type
Purchase Details
Closed on
Jan 16, 2019
Sold by
Johnson Stephen and Jackson Kathy
Bought by
Johnson Stephen and Jackson Kathy
Current Estimated Value
Purchase Details
Closed on
Jul 2, 2018
Sold by
Harris Scott
Bought by
Johnson Stephen and Johnson Kathy
Purchase Details
Closed on
Aug 27, 2014
Sold by
U S Department Of Housing & Urban Develo
Bought by
Harris A Scott
Purchase Details
Closed on
Nov 7, 2013
Sold by
Wells Fargo Bank Na
Bought by
The Secretary Of Housing & Urban Develop
Purchase Details
Closed on
Sep 11, 2013
Sold by
Jajo Julie J
Bought by
Wells Fargo Bank Na
Purchase Details
Closed on
Oct 18, 2002
Sold by
Leibrand Maureen S and Leibrand Charles B
Bought by
Jajo Julie J
Purchase Details
Closed on
Mar 22, 2000
Sold by
Leibrand Charles B and Leibrand Maureen
Bought by
Leibrand Maureen S and Leibrand Charles B
Create a Home Valuation Report for This Property
The Home Valuation Report is an in-depth analysis detailing your home's value as well as a comparison with similar homes in the area
Home Values in the Area
Average Home Value in this Area
Purchase History
| Date | Buyer | Sale Price | Title Company |
|---|---|---|---|
| Johnson Stephen | -- | Cislo Title Co | |
| Johnson Stephen | $55,000 | Cislo Title Co | |
| Harris A Scott | $30,132 | Cislo Title Company | |
| The Secretary Of Housing & Urban Develop | -- | None Available | |
| Wells Fargo Bank Na | $102,682 | None Available | |
| Jajo Julie J | $115,400 | Guaranty Title Company | |
| Leibrand Maureen S | -- | -- |
Source: Public Records
Tax History Compared to Growth
Tax History
| Year | Tax Paid | Tax Assessment Tax Assessment Total Assessment is a certain percentage of the fair market value that is determined by local assessors to be the total taxable value of land and additions on the property. | Land | Improvement |
|---|---|---|---|---|
| 2025 | $2,438 | $83,300 | $0 | $0 |
| 2024 | $1,255 | $75,200 | $0 | $0 |
| 2023 | $1,198 | $72,800 | $0 | $0 |
| 2022 | $1,058 | $66,000 | $0 | $0 |
| 2021 | $2,160 | $63,300 | $0 | $0 |
| 2020 | $1,076 | $52,800 | $0 | $0 |
| 2019 | $1,061 | $47,600 | $0 | $0 |
| 2018 | $2,357 | $41,400 | $0 | $0 |
| 2017 | $1,604 | $41,400 | $0 | $0 |
| 2016 | $1,649 | $36,800 | $0 | $0 |
| 2015 | $1,457 | $36,800 | $0 | $0 |
| 2014 | $1,411 | $35,100 | $0 | $0 |
| 2012 | -- | $32,400 | $32,400 | $0 |
Source: Public Records
Map
Nearby Homes
- 6007 Corunna Rd
- 1442 Mintola Ave
- 6098 Corunna Rd
- 1417 Grassmere Ave
- 5503 Westchester Dr
- 5406 Litchfield Dr
- 6090 Lancaster Dr
- 000 Corunna Rd
- 6172 W Court St
- 5489 Brobeck St
- 0000 Reuben Reuben St
- 00 Corunna Rd
- 1460 S Dye Rd
- 5323 Elmsford Dr
- 5345 Birchtree Ct
- oo Walnut Creek Dr
- 1192 Citation Dr
- 1184 Citation Dr
- 00 Graham St
- 5325 N Dyewood Dr