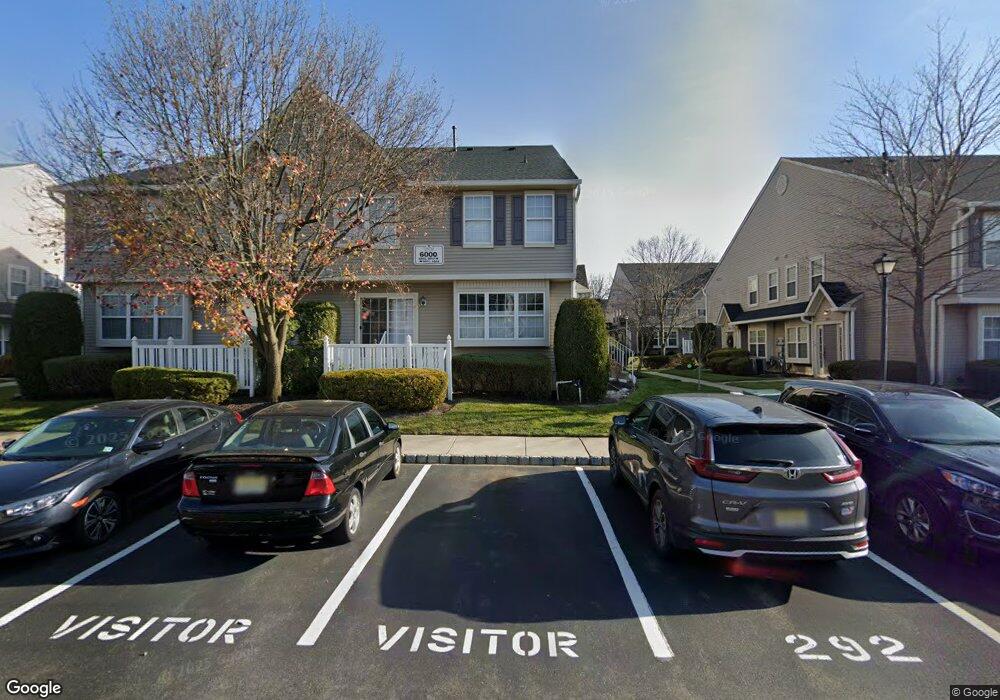
6004 Coventry Way Unit 6004 Mount Laurel, NJ 08054
Estimated Value: $378,264 - $406,000
3
Beds
3
Baths
1,695
Sq Ft
$232/Sq Ft
Est. Value
About This Home
This home is located at 6004 Coventry Way Unit 6004, Mount Laurel, NJ 08054 and is currently estimated at $393,316, approximately $232 per square foot. 6004 Coventry Way Unit 6004 is a home located in Burlington County with nearby schools including Fleetwood Elementary School, Mount Laurel Hartford School, and T.E. Harrington Middle School.
Ownership History
Date
Name
Owned For
Owner Type
Purchase Details
Closed on
Apr 25, 2008
Sold by
Malixi Michael B and Kelly Michelle
Bought by
Haque Faisal R and Haque Sabeen
Current Estimated Value
Home Financials for this Owner
Home Financials are based on the most recent Mortgage that was taken out on this home.
Original Mortgage
$246,137
Outstanding Balance
$156,285
Interest Rate
5.93%
Mortgage Type
Purchase Money Mortgage
Estimated Equity
$237,031
Purchase Details
Closed on
May 15, 2003
Sold by
Yankowskiy Arkadiy and Yankowskaya Inessa V
Bought by
Malixi Michael B and Kelly Michelle
Home Financials for this Owner
Home Financials are based on the most recent Mortgage that was taken out on this home.
Original Mortgage
$179,900
Interest Rate
4.97%
Mortgage Type
Stand Alone First
Purchase Details
Closed on
Nov 24, 1999
Sold by
Orleans Construction Corp
Bought by
Yankovskiy Arkadiy D and Yankovskaya Inessa
Create a Home Valuation Report for This Property
The Home Valuation Report is an in-depth analysis detailing your home's value as well as a comparison with similar homes in the area
Home Values in the Area
Average Home Value in this Area
Purchase History
| Date | Buyer | Sale Price | Title Company |
|---|---|---|---|
| Haque Faisal R | $250,000 | Surety Title Corporation | |
| Malixi Michael B | $199,900 | Integrity Title Agency Inc | |
| Yankovskiy Arkadiy D | $131,385 | Integrity Title Agency |
Source: Public Records
Mortgage History
| Date | Status | Borrower | Loan Amount |
|---|---|---|---|
| Open | Haque Faisal R | $246,137 | |
| Previous Owner | Malixi Michael B | $179,900 |
Source: Public Records
Tax History Compared to Growth
Tax History
| Year | Tax Paid | Tax Assessment Tax Assessment Total Assessment is a certain percentage of the fair market value that is determined by local assessors to be the total taxable value of land and additions on the property. | Land | Improvement |
|---|---|---|---|---|
| 2025 | $6,731 | $213,200 | $45,000 | $168,200 |
| 2024 | $6,477 | $213,200 | $45,000 | $168,200 |
| 2023 | $6,477 | $213,200 | $45,000 | $168,200 |
| 2022 | $6,456 | $213,200 | $45,000 | $168,200 |
| 2021 | $6,334 | $213,200 | $45,000 | $168,200 |
| 2020 | $6,211 | $213,200 | $45,000 | $168,200 |
| 2019 | $6,147 | $213,200 | $45,000 | $168,200 |
| 2018 | $6,100 | $213,200 | $45,000 | $168,200 |
| 2017 | $5,942 | $213,200 | $45,000 | $168,200 |
| 2016 | $5,852 | $213,200 | $45,000 | $168,200 |
| 2015 | $5,784 | $213,200 | $45,000 | $168,200 |
| 2014 | $5,727 | $213,200 | $45,000 | $168,200 |
Source: Public Records
Map
Nearby Homes
- 2605 Saxony Dr Unit 2605
- 4108B Adelaide Dr
- 5108 Halifax Way Unit 5108
- 1406B Saxony Dr Unit 1406
- 1707A Heatherstone Ct
- 8006 Normandy Dr Unit 8006
- 109 Coral Ave
- 35 Stratford Ln
- 163 Memorial Ln
- 64 Stratford Ln
- 2720B Sussex Ct
- 4901A Dunbarton Rd
- 5214C Aberdeen Dr Unit C
- 18 Rosemary Way
- 5116C Aberdeen Dr
- 4617A Aberdeen Dr
- 9 Sister's Farmstead Rd
- 4610B Aberdeen Dr Unit 4610
- 22 Cardinal Way
- 482 Monte Farm Rd
- 6003 Coventry Way Unit 6003
- 6001 Coventry Way Unit 6001
- 6002 Coventry Way Unit 6002
- 6208 Coventry Way Unit 6208
- 5303 Essex Ln Unit 5303
- 6204 Coventry Way Unit 6204
- 5304 Essex Ln Unit 5304
- 5808 Coventry Way Unit 5808
- 5801 Coventry Way Unit 5801
- 6207 Coventry Way Unit 6207
- 6203 Coventry Way Unit 6203
- 5302 Essex Ln Unit 5302
- 5802 Coventry Way Unit 5802
- 5103 Essex Ln Unit 5103
- 5807 Coventry Way Unit 5807
- 5301 Essex Ln Unit 5301
- 5508 Essex Ln Unit 5508
- 6202 Coventry Way Unit 6202
- 5507 Essex Ln Unit 5507
- 5104 Essex Ln Unit 5104