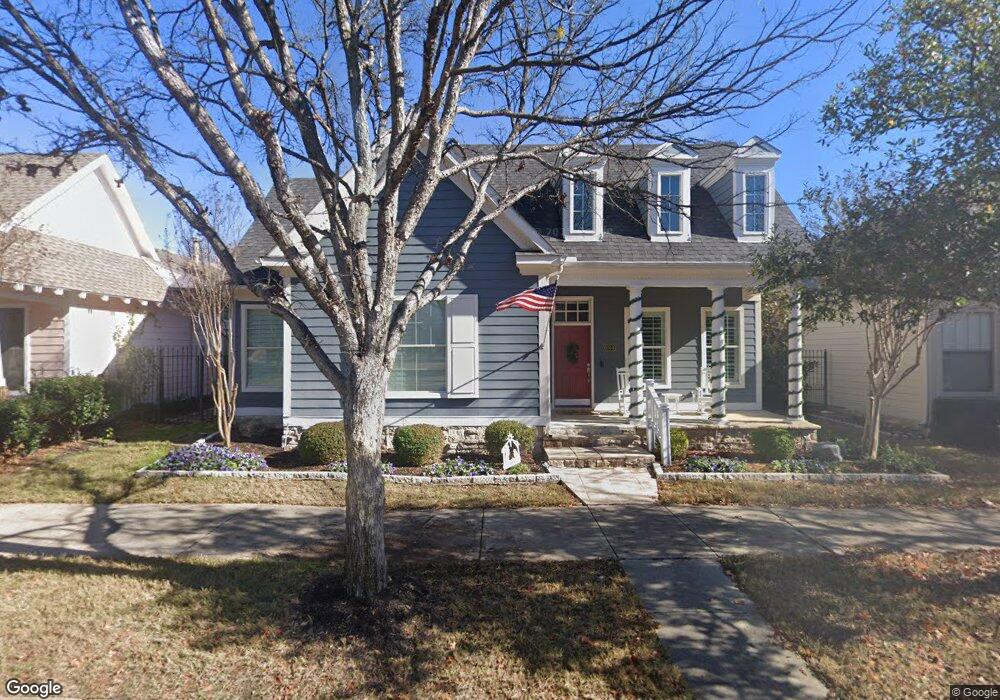
6004 Frost St North Richland Hills, TX 76180
Estimated Value: $497,401 - $531,000
3
Beds
2
Baths
2,231
Sq Ft
$233/Sq Ft
Est. Value
About This Home
This home is located at 6004 Frost St, North Richland Hills, TX 76180 and is currently estimated at $520,350, approximately $233 per square foot. 6004 Frost St is a home located in Tarrant County with nearby schools including Walker Creek Elementary School, Smithfield Middle School, and Birdville High School.
Ownership History
Date
Name
Owned For
Owner Type
Purchase Details
Closed on
May 3, 2016
Sold by
Long Catherine A
Bought by
Allen Robert L and Allen Barbara E
Current Estimated Value
Purchase Details
Closed on
Aug 8, 2005
Sold by
Anderson Jason and Meier Allison Haynes Anderson
Bought by
Long David J and Long Catherine A
Home Financials for this Owner
Home Financials are based on the most recent Mortgage that was taken out on this home.
Original Mortgage
$162,150
Interest Rate
5.51%
Mortgage Type
Fannie Mae Freddie Mac
Purchase Details
Closed on
Sep 29, 2003
Sold by
Cambridge Homes Inc
Bought by
Anderson Jason and Haynes Allison
Home Financials for this Owner
Home Financials are based on the most recent Mortgage that was taken out on this home.
Original Mortgage
$216,550
Interest Rate
6.24%
Mortgage Type
Purchase Money Mortgage
Create a Home Valuation Report for This Property
The Home Valuation Report is an in-depth analysis detailing your home's value as well as a comparison with similar homes in the area
Home Values in the Area
Average Home Value in this Area
Purchase History
| Date | Buyer | Sale Price | Title Company |
|---|---|---|---|
| Allen Robert L | -- | Ttt | |
| Long David J | -- | American Title | |
| Anderson Jason | -- | American Title Mesquite |
Source: Public Records
Mortgage History
| Date | Status | Borrower | Loan Amount |
|---|---|---|---|
| Previous Owner | Long David J | $162,150 | |
| Previous Owner | Anderson Jason | $216,550 |
Source: Public Records
Tax History Compared to Growth
Tax History
| Year | Tax Paid | Tax Assessment Tax Assessment Total Assessment is a certain percentage of the fair market value that is determined by local assessors to be the total taxable value of land and additions on the property. | Land | Improvement |
|---|---|---|---|---|
| 2025 | $3,939 | $484,446 | $51,552 | $432,894 |
| 2024 | $3,939 | $484,446 | $51,552 | $432,894 |
| 2023 | $9,206 | $468,605 | $51,552 | $417,053 |
| 2022 | $9,180 | $406,089 | $51,552 | $354,537 |
| 2021 | $8,825 | $346,815 | $75,000 | $271,815 |
| 2020 | $8,626 | $339,014 | $75,000 | $264,014 |
| 2019 | $9,281 | $352,427 | $75,000 | $277,427 |
| 2018 | $6,034 | $321,000 | $59,500 | $261,500 |
| 2017 | $8,272 | $307,431 | $59,500 | $247,931 |
| 2016 | $7,209 | $267,937 | $34,000 | $233,937 |
| 2015 | $4,938 | $250,300 | $34,000 | $216,300 |
| 2014 | $4,938 | $250,300 | $34,000 | $216,300 |
Source: Public Records
Map
Nearby Homes
- 8321 Bridge St
- 7800 Mockingbird Ln Unit 29
- 7800 Mockingbird Ln Unit 81
- 7800 Mockingbird Ln Unit 73
- 7800 Mockingbird Ln Unit 43
- 7800 Mockingbird Ln Unit 205
- 8240 Bridge St
- 6113 Cliffbrook Dr
- 6025 Kessler Dr
- 6008 Monterey Mews
- 6001 Kessler Dr
- 6116 Morningside Dr
- 8908 Redding St
- 6008 Kessler Dr
- 6017 Avalon St
- 8765 Bridge St
- 6137 Marquita Mews
- 8748 Morris Mews
- 6250 Shirley Dr
- 6105 Parker Blvd
- 6008 Frost St
- 6000 Frost St
- 6012 Frost St
- 8601 Bridge St
- 6016 Frost St
- 8600 Summer Tree Ln
- 8605 Bridge St
- 8604 Summer Tree Ln
- 8524 Bridge St
- 8520 Bridge St
- 8609 Bridge St
- 8528 Bridge St
- 8608 Summer Tree Ln
- 8516 Bridge St
- 6020 Frost St
- 8600 Bridge St
- 8512 Bridge St
- 8604 Bridge St
- 8508 Bridge St
- 8613 Bridge St