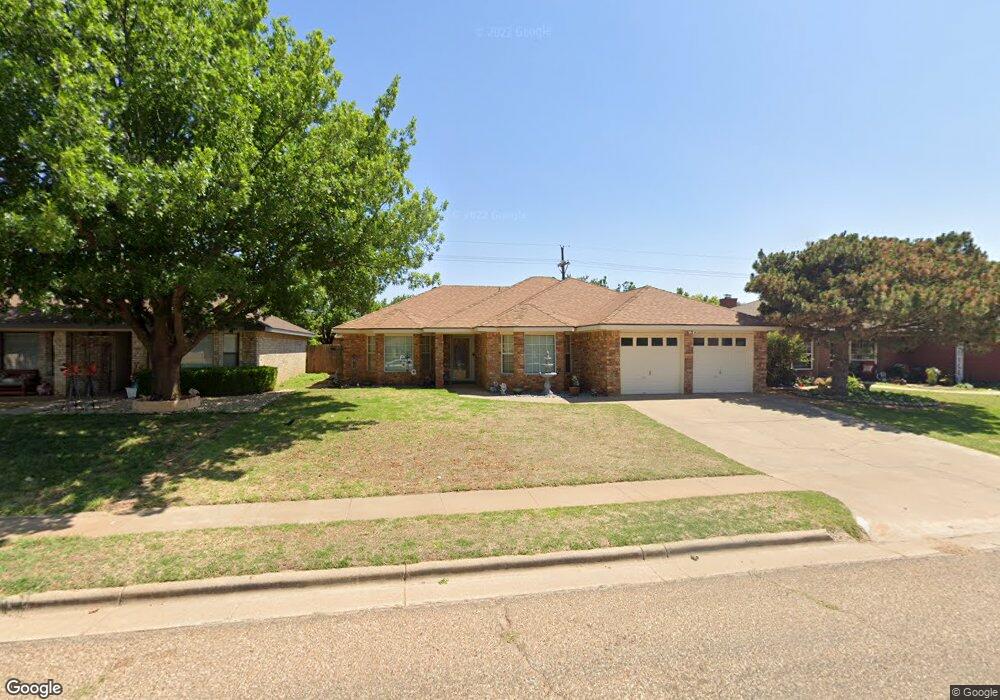
6005 73rd St Lubbock, TX 79424
Estimated Value: $231,000 - $261,000
3
Beds
2
Baths
1,814
Sq Ft
$134/Sq Ft
Est. Value
About This Home
This home is located at 6005 73rd St, Lubbock, TX 79424 and is currently estimated at $242,735, approximately $133 per square foot. 6005 73rd St is a home located in Lubbock County with nearby schools including Crestview Elementary School, Heritage Middle School, and Frenship High School.
Ownership History
Date
Name
Owned For
Owner Type
Purchase Details
Closed on
May 11, 2001
Sold by
Gurley Billy R and Gurley Jenell
Bought by
Tucker John and Tucker Shirley
Current Estimated Value
Purchase Details
Closed on
Aug 23, 1989
Sold by
Bassinger Ron Inc Realtors
Bought by
Tucker John and Tucker Shirley
Purchase Details
Closed on
Mar 10, 1988
Sold by
Bassinger Rothwell
Bought by
Tucker John and Tucker Shirley
Create a Home Valuation Report for This Property
The Home Valuation Report is an in-depth analysis detailing your home's value as well as a comparison with similar homes in the area
Home Values in the Area
Average Home Value in this Area
Purchase History
| Date | Buyer | Sale Price | Title Company |
|---|---|---|---|
| Tucker John | -- | -- | |
| Tucker John | -- | -- | |
| Tucker John | -- | -- |
Source: Public Records
Tax History Compared to Growth
Tax History
| Year | Tax Paid | Tax Assessment Tax Assessment Total Assessment is a certain percentage of the fair market value that is determined by local assessors to be the total taxable value of land and additions on the property. | Land | Improvement |
|---|---|---|---|---|
| 2025 | $2,028 | $226,592 | $17,220 | $209,372 |
| 2024 | $2,028 | $237,360 | $17,220 | $220,140 |
| 2023 | $4,153 | $198,331 | $17,220 | $181,111 |
| 2022 | $4,105 | $180,301 | $17,220 | $174,676 |
| 2021 | $3,964 | $163,910 | $17,220 | $146,690 |
| 2020 | $4,159 | $171,193 | $17,220 | $153,973 |
| 2019 | $4,150 | $166,006 | $17,220 | $148,786 |
| 2018 | $3,786 | $151,251 | $17,220 | $134,031 |
| 2017 | $3,445 | $137,501 | $17,220 | $120,281 |
| 2016 | $3,132 | $125,001 | $17,220 | $107,781 |
| 2015 | $2,690 | $120,209 | $12,300 | $107,909 |
| 2014 | $2,690 | $116,315 | $12,300 | $104,015 |
Source: Public Records
Map
Nearby Homes
- 5912 74th St
- 5909 72nd St
- 6030 72nd St
- 6034 71st St
- 6916 Fulton Ave
- 0 Homestead Ave
- 0 Homestead Ave Unit 202410272
- 0 Homestead Ave Unit 202410273
- 0 Homestead Ave Unit 202410271
- 0 Homestead Ave Unit 202410270
- 6105 75th Place
- 6113 74th St
- 6910 Freeport Ave
- 0 Hope Ave
- 0 Hope Ave Unit 202410262
- 0 Hope Ave Unit 202410265
- 0 Hope Ave Unit 202410264
- 0 Hope Ave Unit 202410263
- 6805 Homestead Ave
- 6021 78th St