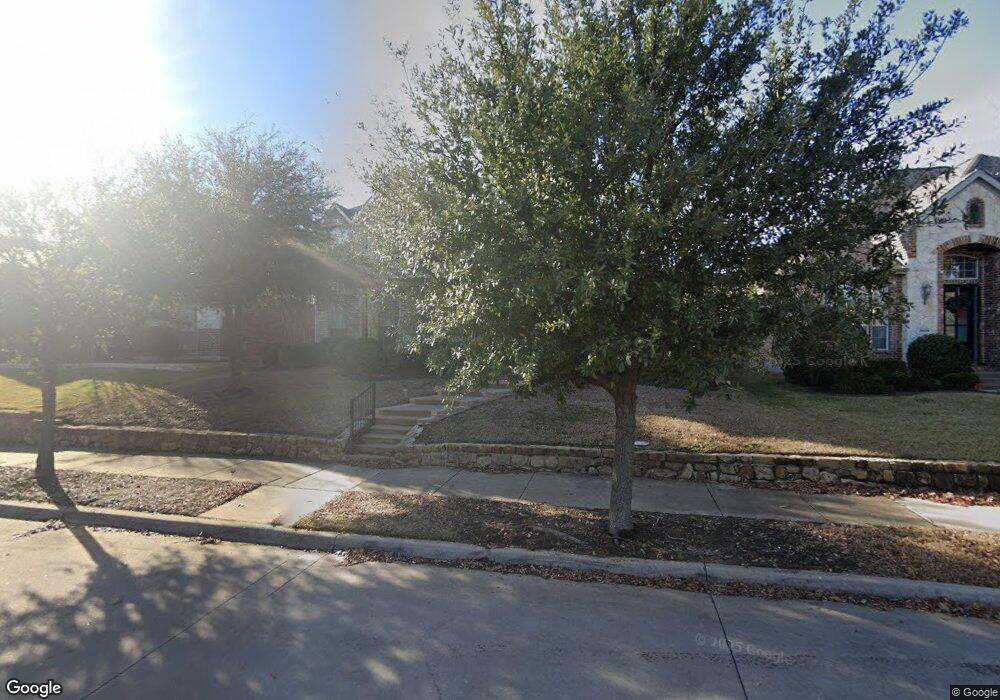
6005 Cripple Creek Trail North Richland Hills, TX 76180
Estimated Value: $582,000 - $645,000
4
Beds
4
Baths
3,285
Sq Ft
$183/Sq Ft
Est. Value
About This Home
This home is located at 6005 Cripple Creek Trail, North Richland Hills, TX 76180 and is currently estimated at $602,666, approximately $183 per square foot. 6005 Cripple Creek Trail is a home located in Tarrant County with nearby schools including Walker Creek Elementary School, Smithfield Middle School, and Birdville High School.
Ownership History
Date
Name
Owned For
Owner Type
Purchase Details
Closed on
Jan 16, 2018
Sold by
Taylor Billy G and Taylor Tammy
Bought by
Howell Jesse L and Howell Elizabeth B
Current Estimated Value
Home Financials for this Owner
Home Financials are based on the most recent Mortgage that was taken out on this home.
Original Mortgage
$275,000
Outstanding Balance
$232,067
Interest Rate
3.94%
Mortgage Type
VA
Estimated Equity
$370,599
Purchase Details
Closed on
May 13, 2009
Sold by
Sumeer Homes Inc
Bought by
Taylor Billy G
Home Financials for this Owner
Home Financials are based on the most recent Mortgage that was taken out on this home.
Original Mortgage
$195,000
Interest Rate
4.84%
Mortgage Type
Purchase Money Mortgage
Create a Home Valuation Report for This Property
The Home Valuation Report is an in-depth analysis detailing your home's value as well as a comparison with similar homes in the area
Home Values in the Area
Average Home Value in this Area
Purchase History
| Date | Buyer | Sale Price | Title Company |
|---|---|---|---|
| Howell Jesse L | -- | None Available | |
| Taylor Billy G | -- | Reunion Title |
Source: Public Records
Mortgage History
| Date | Status | Borrower | Loan Amount |
|---|---|---|---|
| Open | Howell Jesse L | $275,000 | |
| Previous Owner | Taylor Billy G | $195,000 |
Source: Public Records
Tax History Compared to Growth
Tax History
| Year | Tax Paid | Tax Assessment Tax Assessment Total Assessment is a certain percentage of the fair market value that is determined by local assessors to be the total taxable value of land and additions on the property. | Land | Improvement |
|---|---|---|---|---|
| 2025 | $9,396 | $518,000 | $70,252 | $447,748 |
| 2024 | $9,396 | $551,994 | $70,252 | $481,742 |
| 2023 | $10,742 | $558,180 | $70,252 | $487,928 |
| 2022 | $10,713 | $455,545 | $70,252 | $385,293 |
| 2021 | $10,298 | $404,703 | $75,000 | $329,703 |
| 2020 | $9,459 | $371,733 | $75,000 | $296,733 |
| 2019 | $9,789 | $371,733 | $75,000 | $296,733 |
| 2018 | $9,229 | $376,833 | $75,000 | $301,833 |
| 2017 | $9,217 | $342,575 | $75,000 | $267,575 |
| 2016 | $8,781 | $339,385 | $50,000 | $289,385 |
| 2015 | $7,484 | $296,700 | $45,000 | $251,700 |
| 2014 | $7,484 | $296,700 | $45,000 | $251,700 |
Source: Public Records
Map
Nearby Homes
- 5920 Pedernales Ridge
- 6017 Avalon St
- 8020 Bridge St
- 8240 Bridge St
- 7800 Mockingbird Ln Unit 29
- 7800 Mockingbird Ln Unit 81
- 7800 Mockingbird Ln Unit 73
- 7800 Mockingbird Ln Unit 43
- 7800 Mockingbird Ln Unit 205
- 8057 Caladium Dr
- 6113 Cliffbrook Dr
- 7704 Terry Dr
- 7713 Deaver Dr
- 8321 Bridge St
- 6250 Shirley Dr
- 7632 Terry Dr
- 7457 N College Cir
- 5813 Steeplewood Dr
- 7609 Deaver Dr
- 7821 Davis Blvd
- 6009 Cripple Creek Trail
- 6001 Cripple Creek Trail
- 6013 Cripple Creek Trail
- 6004 Pedernales Ridge
- 6008 Pedernales Ridge
- 6000 Pedernales Ridge
- 6012 Pedernales Ridge
- 6004 Cripple Creek Trail
- 6000 Cripple Creek Trail
- 6017 Cripple Creek Trail
- 6016 Pedernales Ridge
- 6008 Cripple Creek Trail
- 5925 Cripple Creek Trail
- 6020 Pedernales Ridge
- 6021 Cripple Creek Trail
- 5932 Pedernales Ridge
- 5920 Cripple Creek Tr
- 6024 Pedernales Ridge
- 5921 Cripple Creek Trail
- 6005 Pedernales Ridge