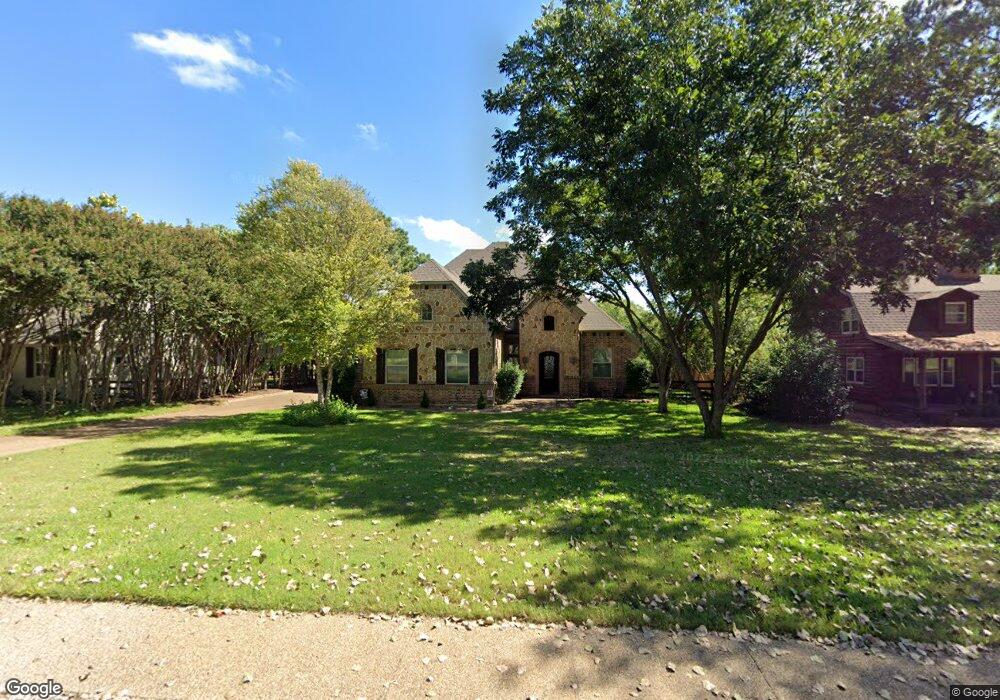
6005 Hunter Ln Colleyville, TX 76034
Estimated Value: $1,147,000 - $1,392,595
4
Beds
3
Baths
3,746
Sq Ft
$336/Sq Ft
Est. Value
About This Home
This home is located at 6005 Hunter Ln, Colleyville, TX 76034 and is currently estimated at $1,258,399, approximately $335 per square foot. 6005 Hunter Ln is a home located in Tarrant County with nearby schools including Colleyville Elementary School, Colleyville Middle School, and Grapevine High School.
Ownership History
Date
Name
Owned For
Owner Type
Purchase Details
Closed on
Oct 3, 2016
Sold by
Thomas Halverson
Bought by
Faragher Jack and Faragher Julie
Current Estimated Value
Home Financials for this Owner
Home Financials are based on the most recent Mortgage that was taken out on this home.
Original Mortgage
$540,000
Outstanding Balance
$432,361
Interest Rate
3.42%
Estimated Equity
$826,038
Purchase Details
Closed on
Mar 19, 2009
Sold by
Moore Jerry D and Moore Janet L
Bought by
Halverson Thomas and Halverson Lori
Home Financials for this Owner
Home Financials are based on the most recent Mortgage that was taken out on this home.
Original Mortgage
$117,000
Interest Rate
5.36%
Mortgage Type
Purchase Money Mortgage
Create a Home Valuation Report for This Property
The Home Valuation Report is an in-depth analysis detailing your home's value as well as a comparison with similar homes in the area
Home Values in the Area
Average Home Value in this Area
Purchase History
| Date | Buyer | Sale Price | Title Company |
|---|---|---|---|
| Faragher Jack | -- | -- | |
| Halverson Thomas | -- | Stnt |
Source: Public Records
Mortgage History
| Date | Status | Borrower | Loan Amount |
|---|---|---|---|
| Open | Faragher Jack | $540,000 | |
| Closed | Faragher Jack | -- | |
| Previous Owner | Halverson Thomas | $117,000 |
Source: Public Records
Tax History Compared to Growth
Tax History
| Year | Tax Paid | Tax Assessment Tax Assessment Total Assessment is a certain percentage of the fair market value that is determined by local assessors to be the total taxable value of land and additions on the property. | Land | Improvement |
|---|---|---|---|---|
| 2025 | $4,170 | $1,385,967 | $282,835 | $1,103,132 |
| 2024 | $4,170 | $1,385,967 | $282,835 | $1,103,132 |
| 2023 | $15,705 | $1,247,000 | $282,835 | $964,165 |
| 2022 | $16,716 | $1,234,374 | $282,835 | $951,539 |
| 2021 | $16,898 | $769,451 | $215,670 | $553,781 |
| 2020 | $16,346 | $735,604 | $215,670 | $519,934 |
| 2019 | $15,678 | $737,867 | $215,670 | $522,197 |
| 2018 | $3,665 | $616,468 | $215,670 | $400,798 |
| 2017 | $14,504 | $613,957 | $215,670 | $398,287 |
| 2016 | $11,824 | $515,000 | $212,670 | $302,330 |
| 2015 | $10,346 | $455,000 | $71,880 | $383,120 |
| 2014 | $10,346 | $455,000 | $71,880 | $383,120 |
Source: Public Records
Map
Nearby Homes
- 6200 Pleasant Run Rd
- 5913 Preston Way
- 5902 Preston Way
- 6401 Westcoat Dr
- 6005 Valentino Ct
- 1315 Hardage Ln
- 6108 Westcoat Dr
- 6900 Sir Spencer Ct
- 6805 Shalimar Ct
- 5609 Oak Top Dr
- 203 Polo Trail
- 217 Oak Valley Dr
- 1509 Tinker Rd
- 200 Valley View Dr N
- 203 Oak Valley Dr
- 407 Timberline Dr N
- 7000 Shalimar Ct
- TBD - Lot 3 John Mccain Rd
- TBD - Lot 1 John Mccain Rd
- Lot 4 Amelia Ct
- 6101 Hunter Ln
- 5917 Hunter Ln
- 6001 Hunter Ln
- 704 Shelton Dr
- 6103 Hunter Ln
- 6000 Hunter Ln
- 6100 Hunter Ln
- 700 Shelton Dr
- 5918 Hunter Ln
- 6104 Hunter Ln
- 612 Shelton Dr
- 800 Shelton Dr
- 6106 Hunter Ln
- 6113 Hunter Ln
- 6208 Pleasant Run Rd
- 608 Shelton Dr
- 6115 Theresa Ln
- 6101 Theresa Ln
- 701 Shelton Dr
- 6108 Hunter Ln