Estimated Value: $390,000 - $425,000
4
Beds
2
Baths
2,200
Sq Ft
$185/Sq Ft
Est. Value
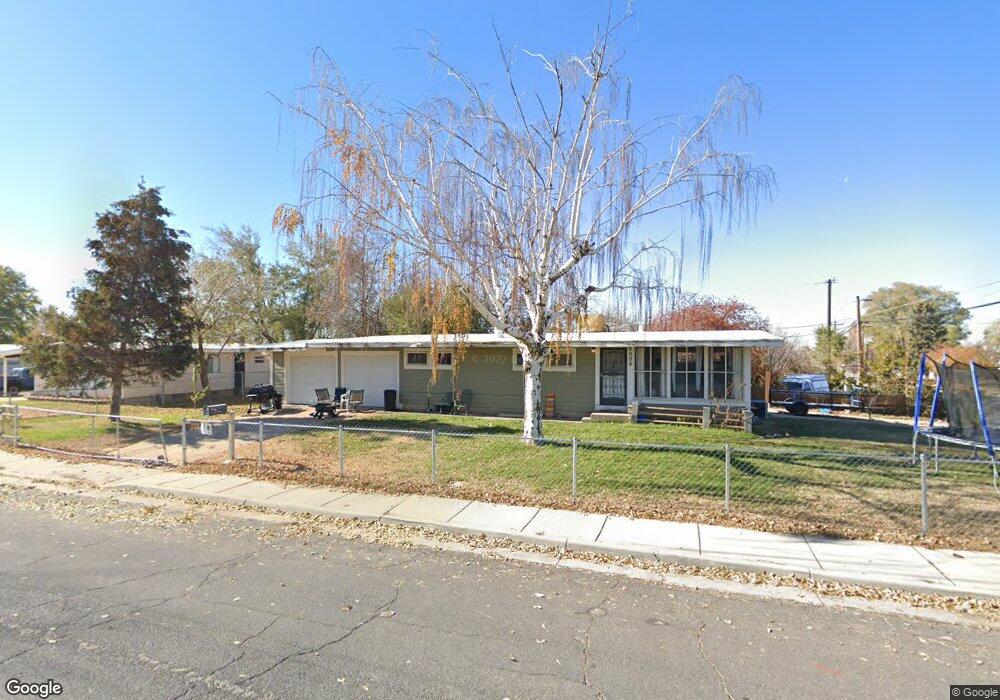
About This Home
This home is located at 6005 S 2100 W, Roy, UT 84067 and is currently estimated at $406,462, approximately $184 per square foot. 6005 S 2100 W is a home located in Weber County with nearby schools including Municipal School, Roy Junior High School, and Roy High School.
Ownership History
Date
Name
Owned For
Owner Type
Purchase Details
Closed on
Sep 18, 2019
Sold by
Romero Ruben Rene
Bought by
Madrigal Francisco and Madrigal Francisco Jose
Current Estimated Value
Home Financials for this Owner
Home Financials are based on the most recent Mortgage that was taken out on this home.
Original Mortgage
$255,192
Outstanding Balance
$222,367
Interest Rate
3.35%
Mortgage Type
FHA
Estimated Equity
$184,095
Purchase Details
Closed on
Jul 12, 2018
Sold by
Buzzell Zachary
Bought by
Romero Ruben Rene
Home Financials for this Owner
Home Financials are based on the most recent Mortgage that was taken out on this home.
Original Mortgage
$234,842
Interest Rate
4.5%
Mortgage Type
VA
Purchase Details
Closed on
Oct 11, 2016
Sold by
Citte Clynt L and Citte Amy K
Bought by
Buzzell Zachary
Home Financials for this Owner
Home Financials are based on the most recent Mortgage that was taken out on this home.
Original Mortgage
$183,767
Interest Rate
3.46%
Mortgage Type
VA
Create a Home Valuation Report for This Property
The Home Valuation Report is an in-depth analysis detailing your home's value as well as a comparison with similar homes in the area
Home Values in the Area
Average Home Value in this Area
Purchase History
| Date | Buyer | Sale Price | Title Company |
|---|---|---|---|
| Madrigal Francisco | -- | Mountain Vien Title Ogden | |
| Romero Ruben Rene | -- | Backman Title Services Ltd | |
| Buzzell Zachary | -- | Old Republic Title |
Source: Public Records
Mortgage History
| Date | Status | Borrower | Loan Amount |
|---|---|---|---|
| Open | Madrigal Francisco | $255,192 | |
| Previous Owner | Romero Ruben Rene | $234,842 | |
| Previous Owner | Buzzell Zachary | $183,767 |
Source: Public Records
Tax History
| Year | Tax Paid | Tax Assessment Tax Assessment Total Assessment is a certain percentage of the fair market value that is determined by local assessors to be the total taxable value of land and additions on the property. | Land | Improvement |
|---|---|---|---|---|
| 2025 | $2,493 | $393,009 | $112,070 | $280,939 |
| 2024 | $2,448 | $213,949 | $61,645 | $152,304 |
| 2023 | $2,380 | $208,450 | $57,059 | $151,391 |
| 2022 | $2,407 | $217,250 | $50,026 | $167,224 |
| 2021 | $1,871 | $275,000 | $63,306 | $211,694 |
| 2020 | $1,670 | $224,000 | $63,306 | $160,694 |
| 2019 | $1,645 | $208,000 | $35,721 | $172,279 |
| 2018 | $1,485 | $175,000 | $33,866 | $141,134 |
| 2017 | $1,360 | $149,000 | $31,248 | $117,752 |
| 2016 | $1,273 | $74,539 | $15,374 | $59,165 |
| 2015 | $1,165 | $69,311 | $15,374 | $53,937 |
| 2014 | $1,102 | $64,232 | $15,374 | $48,858 |
Source: Public Records
Map
Nearby Homes
Your Personal Tour Guide
Ask me questions while you tour the home.