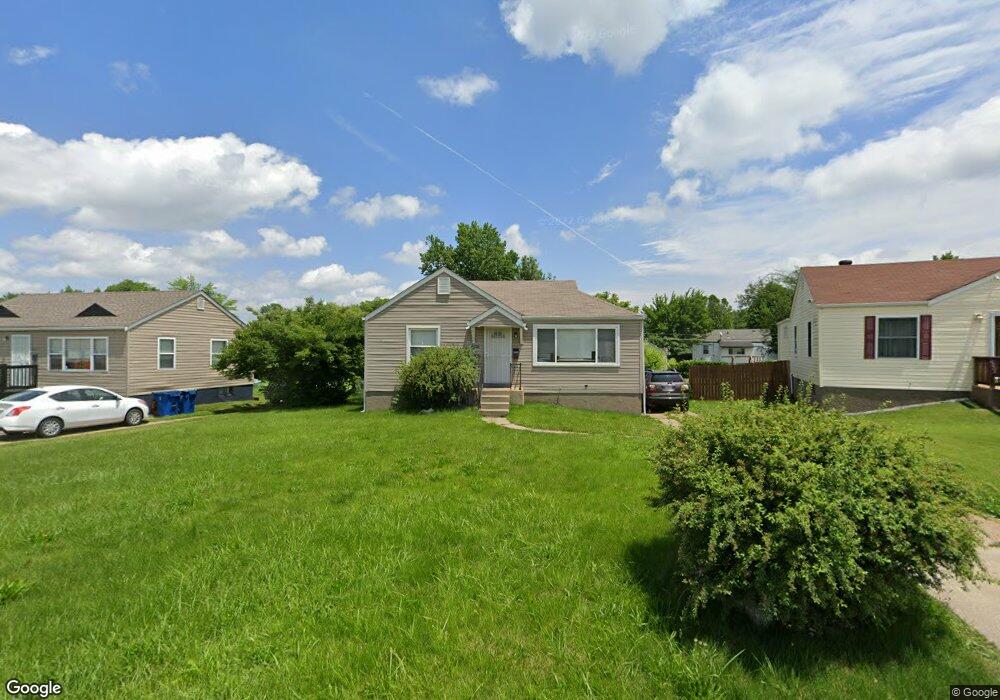
6006 Nevis Ct Saint Louis, MO 63134
Estimated Value: $79,000 - $98,000
2
Beds
1
Bath
792
Sq Ft
$109/Sq Ft
Est. Value
About This Home
This home is located at 6006 Nevis Ct, Saint Louis, MO 63134 and is currently estimated at $86,314, approximately $108 per square foot. 6006 Nevis Ct is a home located in St. Louis County with nearby schools including Berkeley Elementary School, STEAM Academy at McCluer South-Berkeley High School, and Blessed Teresa of Calcutta Catholic School.
Ownership History
Date
Name
Owned For
Owner Type
Purchase Details
Closed on
Mar 19, 2010
Sold by
Jcr Inc
Bought by
Crossroads Management Llc
Current Estimated Value
Purchase Details
Closed on
Mar 11, 2010
Sold by
Wells Fargo Bank N A
Bought by
Jcr Inc
Purchase Details
Closed on
Aug 27, 2009
Sold by
Jones Terry A
Bought by
Wells Fargo Bank Na
Purchase Details
Closed on
May 5, 2006
Sold by
Harper Patrick
Bought by
Jones Terry A
Home Financials for this Owner
Home Financials are based on the most recent Mortgage that was taken out on this home.
Original Mortgage
$52,000
Interest Rate
11.3%
Mortgage Type
Fannie Mae Freddie Mac
Purchase Details
Closed on
Nov 25, 2003
Sold by
Harris Hilda L
Bought by
Harper Patrick
Home Financials for this Owner
Home Financials are based on the most recent Mortgage that was taken out on this home.
Original Mortgage
$40,500
Interest Rate
5.86%
Mortgage Type
Purchase Money Mortgage
Create a Home Valuation Report for This Property
The Home Valuation Report is an in-depth analysis detailing your home's value as well as a comparison with similar homes in the area
Home Values in the Area
Average Home Value in this Area
Purchase History
| Date | Buyer | Sale Price | Title Company |
|---|---|---|---|
| Crossroads Management Llc | $21,500 | None Available | |
| Jcr Inc | $17,000 | None Available | |
| Wells Fargo Bank Na | $51,850 | None Available | |
| Jones Terry A | $65,000 | Ab | |
| Harper Patrick | $45,000 | Archway Title Agency Inc |
Source: Public Records
Mortgage History
| Date | Status | Borrower | Loan Amount |
|---|---|---|---|
| Previous Owner | Jones Terry A | $52,000 | |
| Previous Owner | Harper Patrick | $40,500 |
Source: Public Records
Tax History
| Year | Tax Paid | Tax Assessment Tax Assessment Total Assessment is a certain percentage of the fair market value that is determined by local assessors to be the total taxable value of land and additions on the property. | Land | Improvement |
|---|---|---|---|---|
| 2025 | $986 | $14,200 | $1,240 | $12,960 |
| 2024 | $986 | $12,750 | $1,630 | $11,120 |
| 2023 | $974 | $12,750 | $1,630 | $11,120 |
| 2022 | $665 | $7,510 | $1,240 | $6,270 |
| 2021 | $661 | $7,510 | $1,240 | $6,270 |
| 2020 | $691 | $7,330 | $1,290 | $6,040 |
| 2019 | $663 | $7,330 | $1,290 | $6,040 |
| 2018 | $608 | $6,040 | $1,370 | $4,670 |
| 2017 | $604 | $6,040 | $1,370 | $4,670 |
| 2016 | $926 | $9,080 | $1,750 | $7,330 |
Source: Public Records
Map
Nearby Homes
- 8139 Blanchard Dr
- 8115 Myrick St
- 8234 Airport Rd
- 6151 Avila Dr
- 6005 Shillington Dr
- 6148 Washington Ave
- 8219 Davenport Dr
- 6042 Hancock Ave
- 8027 Aline Ave
- 213 Henquin Dr
- 309 Newell Dr
- 222 Henquin Dr
- 8140 Packard Ave
- 308 Henquin Dr
- 6013 Garfield Ave
- 324 Henquin Dr
- 825 Walters Dr
- 6242 Garfield Ave
- 6237 Garfield Ave
- 318 N Dade Ave
Your Personal Tour Guide
Ask me questions while you tour the home.