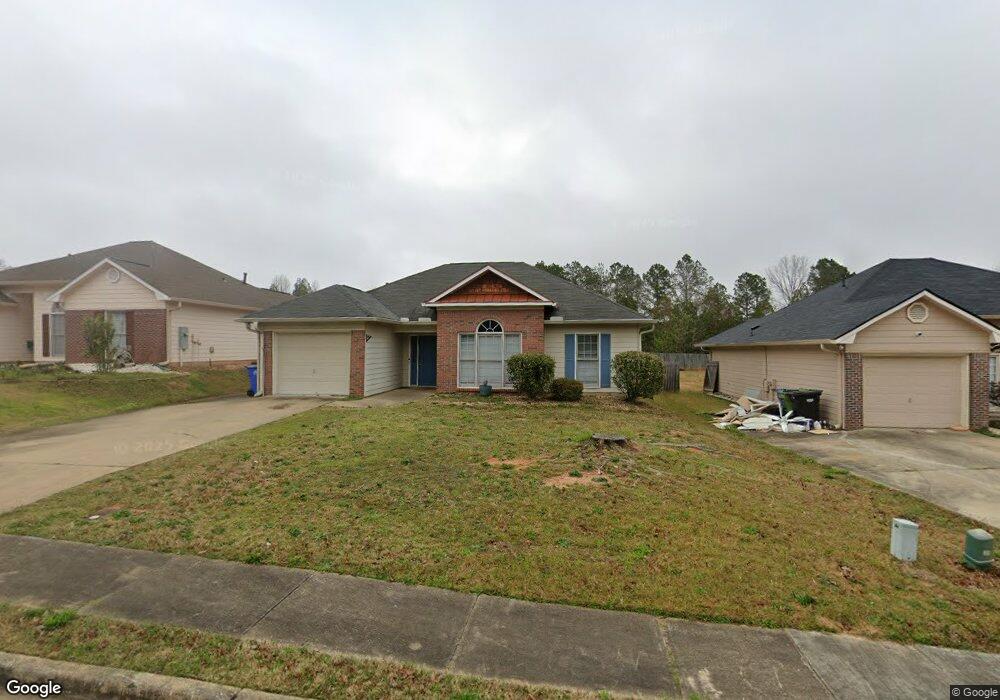
6008 N Pointe Dr Columbus, GA 31909
Northern Columbus NeighborhoodEstimated Value: $177,000 - $192,000
3
Beds
2
Baths
1,510
Sq Ft
$124/Sq Ft
Est. Value
About This Home
This home is located at 6008 N Pointe Dr, Columbus, GA 31909 and is currently estimated at $187,178, approximately $123 per square foot. 6008 N Pointe Dr is a home located in Muscogee County with nearby schools including Gentian Elementary School, Midland Middle School, and Hardaway High School.
Ownership History
Date
Name
Owned For
Owner Type
Purchase Details
Closed on
Oct 11, 2017
Sold by
Pardal Jonathan
Bought by
Tran Chuong and My Xuyen Pham
Current Estimated Value
Home Financials for this Owner
Home Financials are based on the most recent Mortgage that was taken out on this home.
Original Mortgage
$66,000
Outstanding Balance
$15,875
Interest Rate
3.78%
Mortgage Type
New Conventional
Estimated Equity
$171,303
Purchase Details
Closed on
Jun 12, 2014
Sold by
Wommack John C
Bought by
Pardal Jonathan
Home Financials for this Owner
Home Financials are based on the most recent Mortgage that was taken out on this home.
Original Mortgage
$128,627
Interest Rate
3.75%
Mortgage Type
FHA
Purchase Details
Closed on
Apr 7, 2008
Sold by
Gross Roger L
Bought by
Wommack John C and Wommack Jessica
Home Financials for this Owner
Home Financials are based on the most recent Mortgage that was taken out on this home.
Original Mortgage
$160,250
Interest Rate
6.03%
Mortgage Type
VA
Create a Home Valuation Report for This Property
The Home Valuation Report is an in-depth analysis detailing your home's value as well as a comparison with similar homes in the area
Home Values in the Area
Average Home Value in this Area
Purchase History
| Date | Buyer | Sale Price | Title Company |
|---|---|---|---|
| Tran Chuong | $126,000 | -- | |
| Pardal Jonathan | $131,000 | -- | |
| Wommack John C | $156,900 | None Available |
Source: Public Records
Mortgage History
| Date | Status | Borrower | Loan Amount |
|---|---|---|---|
| Open | Tran Chuong | $66,000 | |
| Previous Owner | Pardal Jonathan | $128,627 | |
| Previous Owner | Wommack John C | $160,250 |
Source: Public Records
Tax History Compared to Growth
Tax History
| Year | Tax Paid | Tax Assessment Tax Assessment Total Assessment is a certain percentage of the fair market value that is determined by local assessors to be the total taxable value of land and additions on the property. | Land | Improvement |
|---|---|---|---|---|
| 2025 | $253 | $64,744 | $9,800 | $54,944 |
| 2024 | $2,534 | $64,744 | $9,800 | $54,944 |
| 2023 | $2,550 | $64,744 | $9,800 | $54,944 |
| 2022 | $2,094 | $51,284 | $9,800 | $41,484 |
| 2021 | $1,963 | $48,080 | $9,800 | $38,280 |
| 2020 | $1,964 | $48,080 | $9,800 | $38,280 |
| 2019 | $1,970 | $48,080 | $9,800 | $38,280 |
| 2018 | $1,970 | $48,080 | $9,800 | $38,280 |
| 2017 | $1,607 | $47,128 | $9,800 | $37,328 |
| 2016 | $1,614 | $52,400 | $9,600 | $42,800 |
| 2015 | $1,617 | $52,400 | $9,600 | $42,800 |
| 2014 | $2,048 | $62,760 | $9,600 | $53,160 |
| 2013 | -- | $62,760 | $9,600 | $53,160 |
Source: Public Records
Map
Nearby Homes
- 5540 Rodgers Dr
- 5517 Rodgers Dr
- 5224 Miller Rd
- 5636 Webb Ave
- 5216 Moon Rd
- 4832 Rowland Ave
- 4813 Rowland Ct
- 3872 E Britt David Rd
- 3710 Winkfield Place
- 4709 Rowland Ave
- 3618 Grier Ave
- 5829 Moon Rd
- 5921 Lawson St
- 5866 Morningside Dr
- 5915 Frazier Dr
- 5926 Frazier Dr
- 4807 Fairview Dr
- 4036 Wilbur Dr
- 4121 Wilbur Dr
- 5435 Wayne Dr
- 6004 N Pointe Dr
- 6012 N Pointe Dr
- 6000 N Pointe Dr
- 6016 N Pointe Dr
- 6020 N Pointe Dr
- 5996 N Pointe Dr
- 6005 N Pointe Dr
- 6009 N Pointe Dr
- 0 N Pointe Dr
- 6013 N Pointe Dr
- 4006 Pittman St
- 6024 N Pointe Dr
- 6001 N Pointe Dr
- 6017 N Pointe Dr
- 4004 Pittman St
- 6021 N Pointe Dr
- 6028 N Pointe Dr
- 6025 N Pointe Dr
- 4002 Pittman St
- 6032 N Pointe Dr