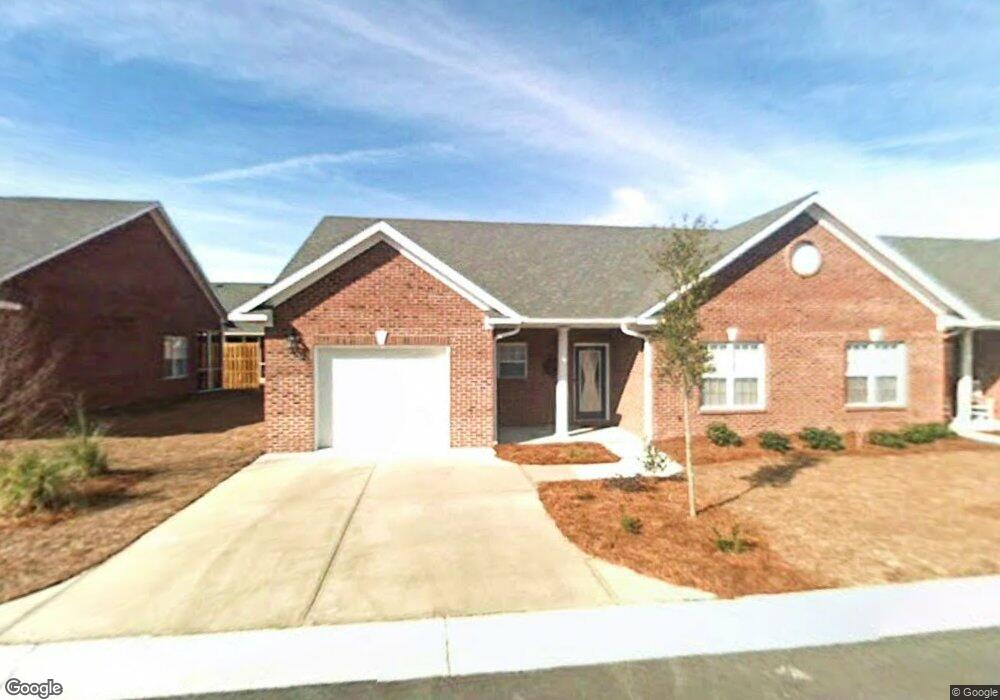
6008 Slipper Shell St Wilmington, NC 28412
Beau Rivage NeighborhoodEstimated Value: $315,000 - $335,000
3
Beds
3
Baths
1,349
Sq Ft
$239/Sq Ft
Est. Value
About This Home
This home is located at 6008 Slipper Shell St, Wilmington, NC 28412 and is currently estimated at $322,026, approximately $238 per square foot. 6008 Slipper Shell St is a home located in New Hanover County with nearby schools including Heyward C. Bellamy Elementary School, Charles P. Murray Middle School, and Eugene Ashley High School.
Ownership History
Date
Name
Owned For
Owner Type
Purchase Details
Closed on
Aug 11, 2011
Sold by
Federal Home Loan Mortgage Corporation
Bought by
Smist John Erik and Smist Alyson Melanie
Current Estimated Value
Home Financials for this Owner
Home Financials are based on the most recent Mortgage that was taken out on this home.
Original Mortgage
$123,780
Outstanding Balance
$85,277
Interest Rate
4.54%
Mortgage Type
FHA
Estimated Equity
$236,749
Purchase Details
Closed on
May 11, 2011
Sold by
Fouch Kelly B and Fouch Jill L
Bought by
Federal Home Loan Mortgage Corporation
Create a Home Valuation Report for This Property
The Home Valuation Report is an in-depth analysis detailing your home's value as well as a comparison with similar homes in the area
Home Values in the Area
Average Home Value in this Area
Purchase History
| Date | Buyer | Sale Price | Title Company |
|---|---|---|---|
| Smist John Erik | -- | None Available | |
| Federal Home Loan Mortgage Corporation | -- | None Available |
Source: Public Records
Mortgage History
| Date | Status | Borrower | Loan Amount |
|---|---|---|---|
| Open | Smist John Erik | $123,780 |
Source: Public Records
Tax History Compared to Growth
Tax History
| Year | Tax Paid | Tax Assessment Tax Assessment Total Assessment is a certain percentage of the fair market value that is determined by local assessors to be the total taxable value of land and additions on the property. | Land | Improvement |
|---|---|---|---|---|
| 2025 | $1,027 | $315,300 | $50,000 | $265,300 |
| 2024 | $1,027 | $186,800 | $40,000 | $146,800 |
| 2023 | $1,023 | $186,800 | $40,000 | $146,800 |
| 2022 | $1,032 | $186,800 | $40,000 | $146,800 |
| 2021 | $1,031 | $186,800 | $40,000 | $146,800 |
| 2020 | $946 | $149,500 | $30,000 | $119,500 |
| 2019 | $946 | $149,500 | $30,000 | $119,500 |
| 2018 | $946 | $149,500 | $30,000 | $119,500 |
| 2017 | $968 | $149,500 | $30,000 | $119,500 |
| 2016 | $922 | $133,100 | $30,000 | $103,100 |
| 2015 | $857 | $133,100 | $30,000 | $103,100 |
| 2014 | $843 | $133,100 | $30,000 | $103,100 |
Source: Public Records
Map
Nearby Homes
- 6015 Slipper Shell St
- 443 Lightning Whelk Way
- 445 Lightning Whelk Way Unit 445445
- 1016 Rivage Promenade
- 6005 Otter Tail Trail
- 6009 Otter Tail Trail
- 428 Motts Forest Rd
- 804 Rivage Promenade
- 453 Motts Forest Rd Unit (Lot 70)
- 457 Motts Forest Rd Unit (Lot 69)
- 333 Motts Forest Rd
- 606 Manassas Dr
- 6046 Shiloh Dr
- 315 Motts Forest Rd
- 6007 Mount Carmel Parke
- 5913 Fayemont Ct
- 310 White Swan Ct
- 707 Liberty Landing Way
- 6257 Sweet Gum Dr
- 5923 Motts Village Rd
- 6008 Slipper Shell St Unit A
- 6006 Slipper Shell St
- 6012 Slipper Shell St
- 6021 Banded Tulip Dr
- 6004 Slipper Shell St
- 6025 Banded Tulip Dr
- 6014 Slipper Shell St
- 6017 Banded Tulip Dr
- 6009 Slipper Shell St
- 6002 Slipper Shell St
- 6007 Slipper Shell St
- 6027 Banded Tulip Dr
- 6013 Slipper Shell St
- 6016 Slipper Shell St
- 6015 Banded Tulip Dr
- 6005 Slipper Shell St
- 6029 Banded Tulip Dr
- 6003 Slipper Shell St
- 6018 Slipper Shell St
- 6024 Banded Tulip Dr