Estimated Value: $160,469 - $219,000
--
Bed
--
Bath
1,240
Sq Ft
$153/Sq Ft
Est. Value
About This Home
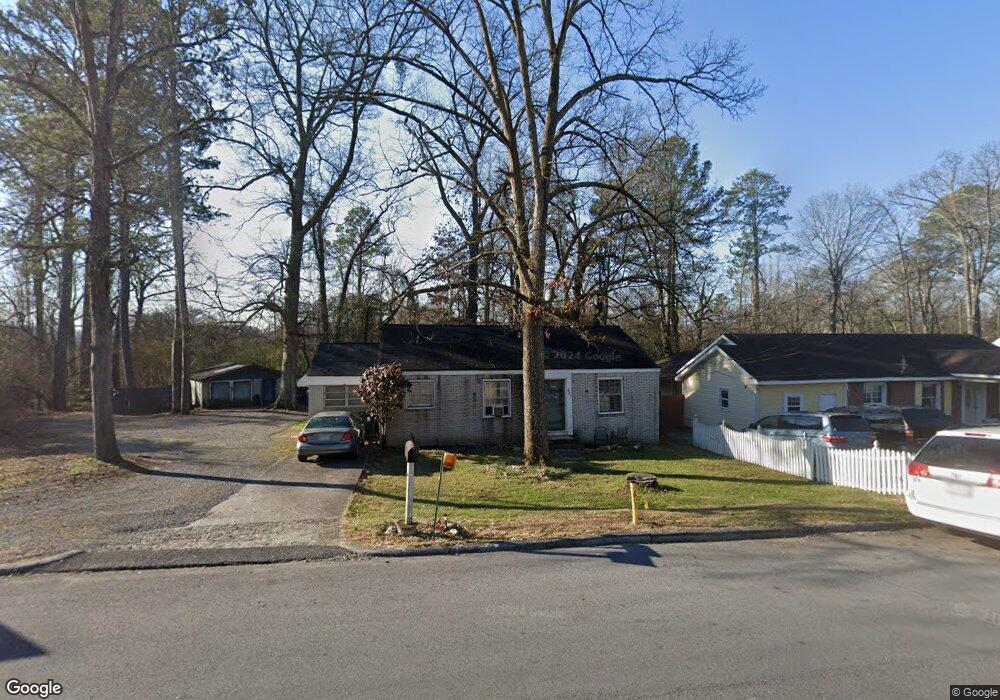
This home is located at 601 Charlton St NW, Rome, GA 30165 and is currently estimated at $190,117, approximately $153 per square foot. 601 Charlton St NW is a home located in Floyd County with nearby schools including Rome High School.
Ownership History
Date
Name
Owned For
Owner Type
Purchase Details
Closed on
Aug 14, 1992
Sold by
Ashworth Cathryn
Bought by
Roberts Paul
Current Estimated Value
Purchase Details
Closed on
Jan 15, 1992
Sold by
Ashworth W Dennis
Bought by
Ashworth Cathryn
Purchase Details
Closed on
Sep 13, 1989
Sold by
Knight James G
Bought by
Ashworth W Dennis
Purchase Details
Closed on
Oct 1, 1984
Sold by
Payne Gina
Bought by
Knight James G
Purchase Details
Closed on
Oct 9, 1980
Sold by
Mitchell Trana C
Bought by
Payne Gina
Purchase Details
Closed on
Mar 14, 1980
Sold by
Mitchell Harold E and Mitchell Trana C
Bought by
Mitchell Trana C
Purchase Details
Closed on
Jan 8, 1974
Sold by
Andrews Gary
Bought by
Mitchell Harold E and Mitchell Trana C
Purchase Details
Closed on
Jul 11, 1973
Sold by
Myrick Jamesrichard
Bought by
Andrews Gary
Purchase Details
Closed on
May 29, 1973
Sold by
Terrel David
Bought by
Myrick Jamesrichard
Purchase Details
Closed on
Dec 28, 1972
Sold by
Godfrey William R
Bought by
Terrel David
Purchase Details
Closed on
May 8, 1969
Sold by
Tierce William Lester
Bought by
Godfrey William R
Purchase Details
Closed on
Apr 26, 1968
Sold by
Tierce W S
Bought by
Tierce William Lester
Purchase Details
Closed on
Jan 1, 1956
Bought by
Tierce W S
Create a Home Valuation Report for This Property
The Home Valuation Report is an in-depth analysis detailing your home's value as well as a comparison with similar homes in the area
Home Values in the Area
Average Home Value in this Area
Purchase History
| Date | Buyer | Sale Price | Title Company |
|---|---|---|---|
| Roberts Paul | $34,000 | -- | |
| Ashworth Cathryn | $33,000 | -- | |
| Ashworth W Dennis | $31,000 | -- | |
| Knight James G | $29,000 | -- | |
| Payne Gina | $27,900 | -- | |
| Mitchell Trana C | -- | -- | |
| Mitchell Harold E | $1,000 | -- | |
| Andrews Gary | $17,500 | -- | |
| Myrick Jamesrichard | -- | -- | |
| Terrel David | $1,700 | -- | |
| Godfrey William R | $13,500 | -- | |
| Tierce William Lester | -- | -- | |
| Tierce W S | -- | -- |
Source: Public Records
Tax History Compared to Growth
Tax History
| Year | Tax Paid | Tax Assessment Tax Assessment Total Assessment is a certain percentage of the fair market value that is determined by local assessors to be the total taxable value of land and additions on the property. | Land | Improvement |
|---|---|---|---|---|
| 2024 | $2,393 | $62,226 | $7,838 | $54,388 |
| 2023 | $2,204 | $53,839 | $7,107 | $46,732 |
| 2022 | $1,626 | $44,555 | $5,890 | $38,665 |
| 2021 | $1,363 | $36,737 | $5,597 | $31,140 |
| 2020 | $1,271 | $33,966 | $4,259 | $29,707 |
| 2019 | $1,103 | $29,789 | $4,259 | $25,530 |
| 2018 | $1,039 | $28,076 | $4,259 | $23,817 |
| 2017 | $1,013 | $27,356 | $4,259 | $23,097 |
| 2016 | $1,001 | $26,960 | $4,240 | $22,720 |
| 2015 | $945 | $26,960 | $4,240 | $22,720 |
| 2014 | $945 | $26,960 | $4,240 | $22,720 |
Source: Public Records
Map
Nearby Homes
- 614 Briarwood Cir NW
- 808 Charlton St NW
- 204 Oakwood St NW
- 7 Raymond Ave NW
- 208 Dodd St NW
- 105 Robin St NW
- 0 Unbridled Rd Unit 22 23074684
- 124 Sheridan Dr NW
- 23 Sweetspire Dr NW
- 21 Sweetspire Dr NW
- 15 Silverbell Ln
- 4 Colonial Dr NW
- 209 Sherwood Rd SW
- 9 Shorter Cir SW
- 8 S Hughes St SW
- 214 N Elm St NW
- 3 Berckman Ln SW
- 19 Berckman Ln SW
- 603 Charlton St NW
- 605 Charlton St NW
- 32 Vineland Dr NW
- 32 Vineland Dr NW
- 523 Charlton St NW
- 607 Charlton St NW
- 600 Charlton St NW
- 602 Charlton St NW
- 609 Charlton St NW
- 521 Charlton St NW
- 514 Charlton St NW
- 519 Charlton St NW
- 701 Charlton St NW
- 26 Vineland Dr NW
- 602 Briarwood Cir NW
- 28 Vineland Dr NW
- 512 Charlton St NW
- 517 Charlton St NW
- 24 Vineland Dr NW
- 703 Charlton St NW